
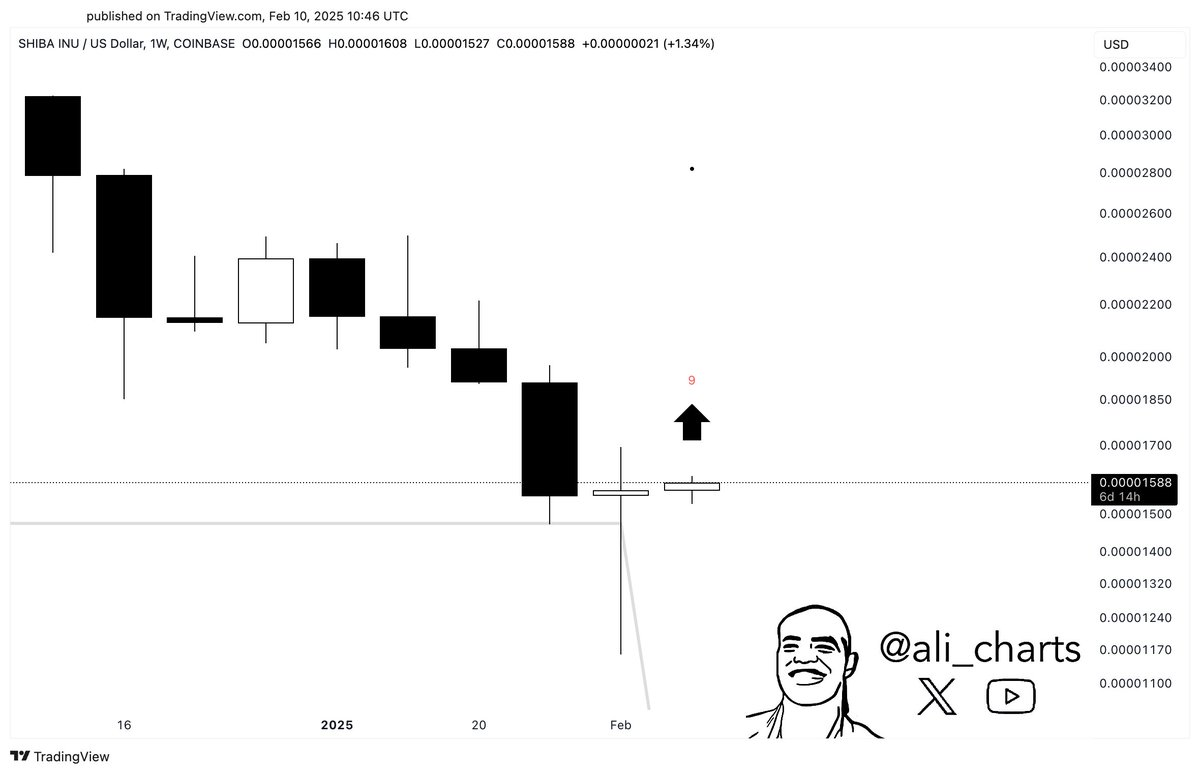
- Shiba Inu TD Sequential has just flipped the buy signal for the SHIB price action.
- SHIB is trading below its 20-day EMA and has crashed a massive 5.15% in 24 hours.
- SHIB whale transactions soared to the weekly high of 115 transactions.
Shiba Inu (SHIB) is starting to hint at a potential rebound after a long downtrend.
Good news is, key technical indicators and whale activity suggest the mood is shifting in the market as the altcoin trades at $0.00001556 right now, having dipped 5.15% in the last day, CoinMarketCap data confirms.
Buy Signal Flashing for SHIB? Analyst Weighs In
Crypto analyst Ali Martinez highlighted a bullish signal on SHIB’s weekly chart, sharing a weekly chart in a post on X (formerly Twitter).
The TD Sequential indicator has flashed a buy signal, which historically means a reversal or at least a short-term price recovery could be coming. SHIB has been heading south for the past few weeks, and this indicator suggests that selling pressure might be easing, which could clear the way for a potential recovery.
Related: Dogecoin (DOGE) Price: Analyst Eyes $4 on Bullish Chart
Whale Wallets Stirring Up SHIB Market
On the other hand, on-chain data from IntoTheBlock confirms a surge in Shiba Inu whale activity.
Over 115 SHIB whale transactions were recorded in just the last 24 hours, hitting a weekly high, along with large transactions totaling $34.32 million. Over 2.19 trillion SHIB tokens were moved yesterday, with the weekly high being 4.35 trillion SHIB.
SHIB Price Needs to Conquer Key Hurdle
It is important to note that SHIB is trading below its 20-day Exponential Moving Average (EMA) at $0.00001707.
Breaking above this level could confirm a trend reversal and push prices toward the next resistance zones. If bulls can manage to reclaim this level, possible upside targets include $0.00001850 and $0.00002000, both of which have been key resistance levels before.
Technical Indicators Hint at Bullish Turn for SHIB
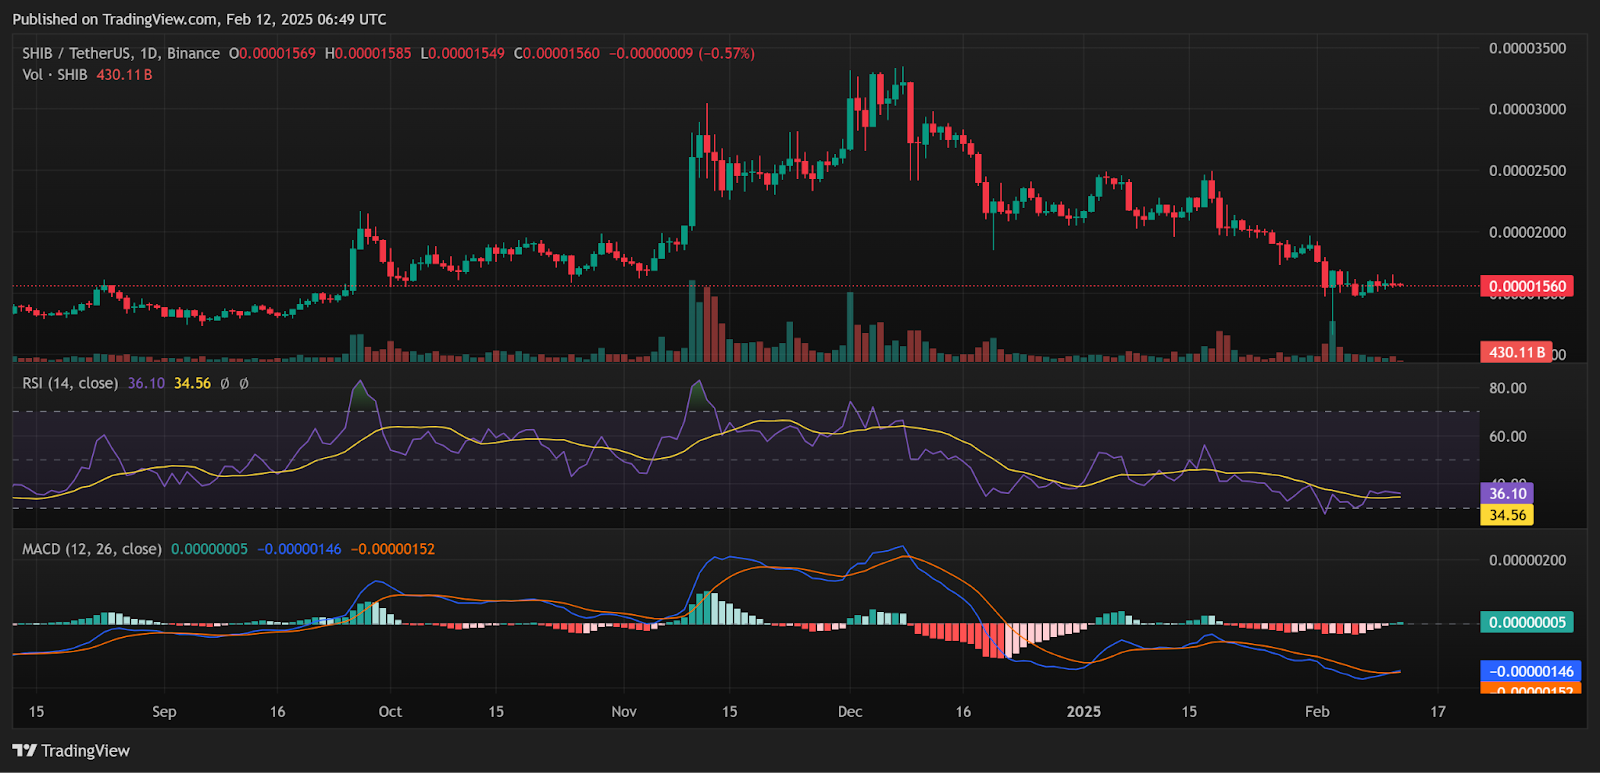
The Relative Strength Index (RSI) is currently at 36.10 for the Shiba Inu price action, showing that the digital asset is nearing oversold conditions.
Related: Dogecoin Whales Load Up: 100M Tokens Bought, $0.60 Target in Sight
If RSI moves above 40, it could signal that bullish momentum is getting stronger. At the same time, the MACD indicator shows that selling pressure has weakened, with the MACD line (blue) approaching a potential bullish crossover with the signal line (red).
Disclaimer: The information presented in this article is for informational and educational purposes only. The article does not constitute financial advice or advice of any kind. Coin Edition is not responsible for any losses incurred as a result of the utilization of content, products, or services mentioned. Readers are advised to exercise caution before taking any action related to the company.


