- SHIB trades near $0.00000851 after another rejection at the top of its descending channel.
- EMA cluster stays bearish as sellers defend $0.00000880 to $0.00000954 on every bounce.
- Spot outflows and weak inflows keep the trend pressured as $0.00000820 and $0.0000072 support levels come into play.
Shiba Inu price today trades near $0.00000851, slipping after another rejection at the upper boundary of its multi month descending channel. The move keeps pressure on buyers as spot outflows continue and the EMA cluster strengthens its role as overhead resistance.
EMA Cluster Limits Every Bounce

SHIB remains locked inside a descending channel that has guided price action since January. Each attempt to break above the channel has failed, including the recent test near $0.0000090, where sellers stepped in and forced price back toward the lower half of the range.
The daily EMAs reinforce this structure. SHIB trades below the 20 day EMA at $0.00000880, the 50 day EMA at $0.00000954, the 100 day EMA at $0.00000969, and the 200 day EMA at $0.00001199. This alignment keeps the trend pointed lower and shows that buyers do not have the momentum required to reclaim lost levels.
Related: Bitcoin Price Prediction: BTC Faces Tight Recovery Window as Key Fibonacci Levels Limit Upside
The Supertrend indicator sits at $0.00000954, highlighting the strong ceiling above current price. This band has stayed red for most of November, and until SHIB closes above it, trend control stays with the sellers.
The broader channel suggests room for a deeper move if the lower boundary near $0.0000072 is tested again. That area has acted as a major demand zone and now represents the next critical support if downside continues.
Spot Outflows Show Ongoing Distribution

Coinglass data shows $380,000 in net outflows on November 26. While smaller in scale compared to large cap assets, the consistent pattern is clear. Red prints have dominated SHIB’s flow chart for most of the past three months.
Negative netflows usually reflect distribution rather than accumulation. Traders send tokens back to exchanges, increasing available supply and reducing upward pressure. This environment has contributed to the sustained downtrend, with SHIB unable to convert any short term rallies into lasting breakouts.
Related: XRP Price Prediction: XRP Attempts Reversal as Key Levels Tighten and Flows Stay Negative
The lack of sustained inflow also explains why each EMA test leads to immediate rejection. Buyers are stepping in at support levels, but the broader market is not rotating fresh capital into SHIB.
Flows need to turn positive for sentiment to shift. Until then, every bounce remains tactical rather than trend forming.
Intraday Momentum Attempts To Stabilize

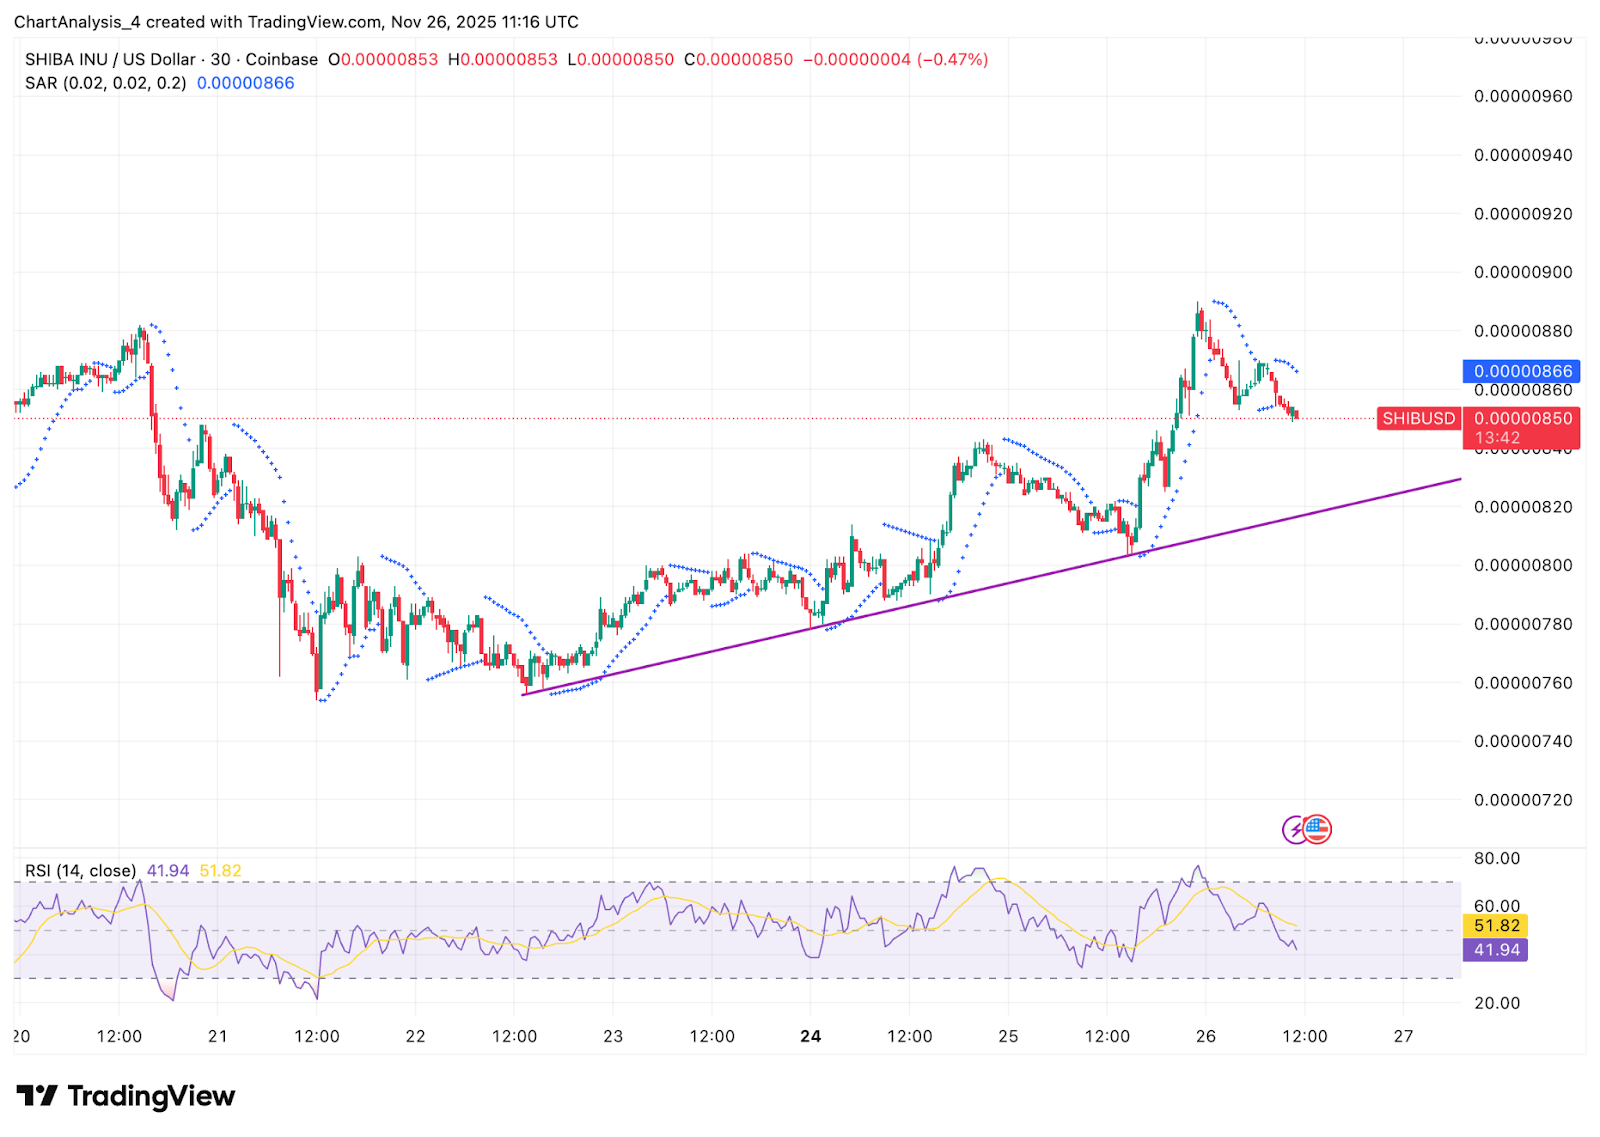
The 30 minute chart shows SHIB forming a rising support line from the November low near $0.0000076. This creates an intraday uptrend inside the broader downtrend, a structure that often signals temporary stabilization. Price touched $0.00000886 earlier today before pulling back to the current level.
Parabolic SAR dots remain above price, signaling that short term momentum is still cooling after the earlier rally. The RSI sits near 41, showing that the market is losing strength without being oversold. This combination suggests that SHIB is entering a consolidation phase rather than forming a decisive breakout.
The rising intraday trendline near $0.00000820 is the key level to watch. A bounce from this area would allow buyers to attempt another push toward $0.00000870 and $0.00000890, the local resistance band. A breakdown below the trendline shifts momentum back toward the channel midpoint and increases the chance of a retest of the major daily support area.
Outlook. Will Shiba Inu Go Up?
Shiba Inu now faces two clear scenarios.
- Bullish case: A daily close above $0.00000890 signals strength. A break above the 20 day EMA at $0.00000880 and the 50 day EMA at $0.00000954 flips short term momentum. Confirmed strength comes with a breakout above $0.00000990, opening a move toward $0.0000105 and the 200 day EMA.
- Bearish case: Losing $0.00000820 exposes $0.0000076, the first intraday demand zone. A breakdown below this level brings $0.0000072 into focus. A close beneath that support signals a deeper correction toward $0.0000068.
Related: Ethereum Price Prediction: ETH Stalls Near $3,000 as Spot Outflows Crush ETF Bid Support
Disclaimer: The information presented in this article is for informational and educational purposes only. The article does not constitute financial advice or advice of any kind. Coin Edition is not responsible for any losses incurred as a result of the utilization of content, products, or services mentioned. Readers are advised to exercise caution before taking any action related to the company.


