
The Shiba Inu price today is hovering around $0.00001137 after recovering modestly from a deep intraday dip toward $0.00001120. While buyers defended the lower bounds of the descending pitchfork and demand zone, upside momentum remains capped below trendline resistance and EMA clusters. This leaves traders closely watching for signs of breakdown or breakout amid growing Shiba Inu price volatility.
The token’s broader structure remains bearish, as Shiba Inu price action continues to register lower highs within a controlled descending channel. Traders are now asking why Shiba Inu price going down today, and whether the market can hold current levels or give way to further losses.
What’s Happening With Shiba Inu’s Price?
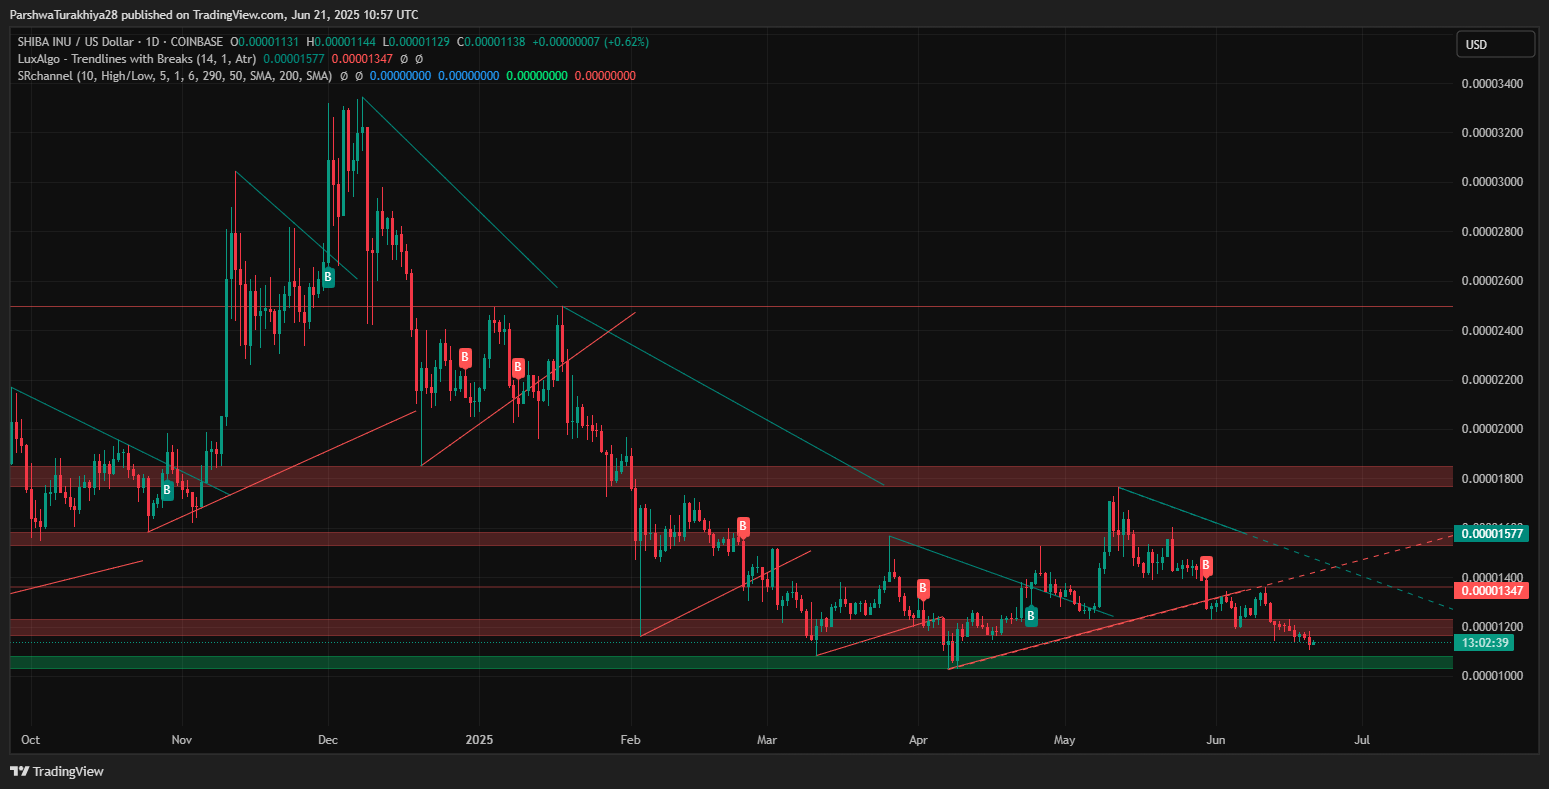
SHIB continues to trade in a downtrend with persistent sell pressure evident across all major timeframes. On the daily chart, the asset remains below the key trendline from its April highs, with lower highs and lower lows carving out a clearly bearish structure. A series of failed attempts to reclaim the $0.00001210–$0.00001230 resistance zone reinforce the idea of overhead supply dominance.
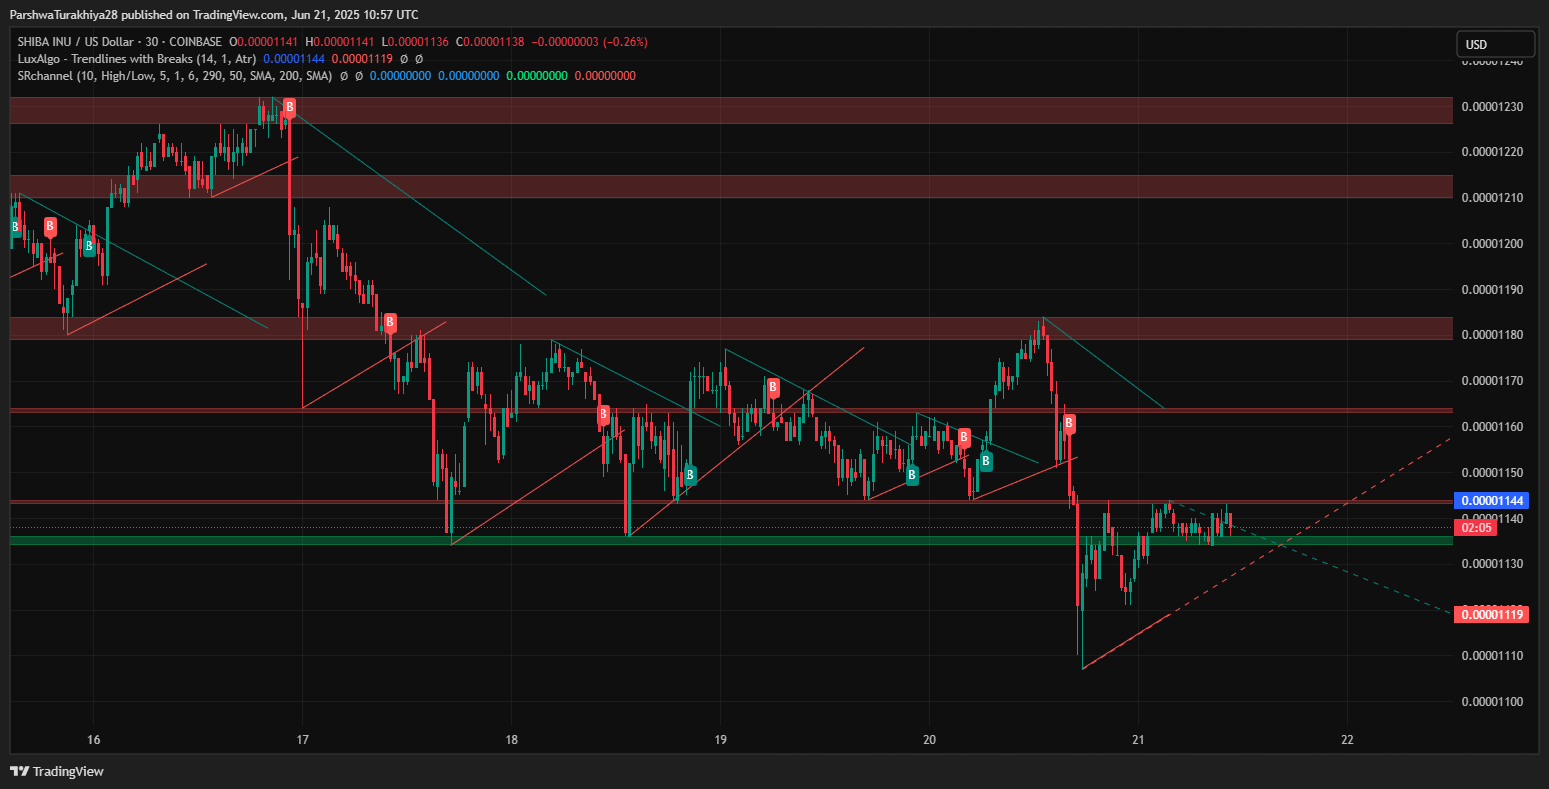
The latest Shiba Inu price update shows that while the token bounced off the $0.00001120–$0.00001128 support zone, price action remains sluggish and trapped beneath key levels. A crucial confluence exists near $0.00001144, which acts as both local resistance and a median line from the short-term pitchfork channel.
Key Technical Levels Keep SHIB Constrained

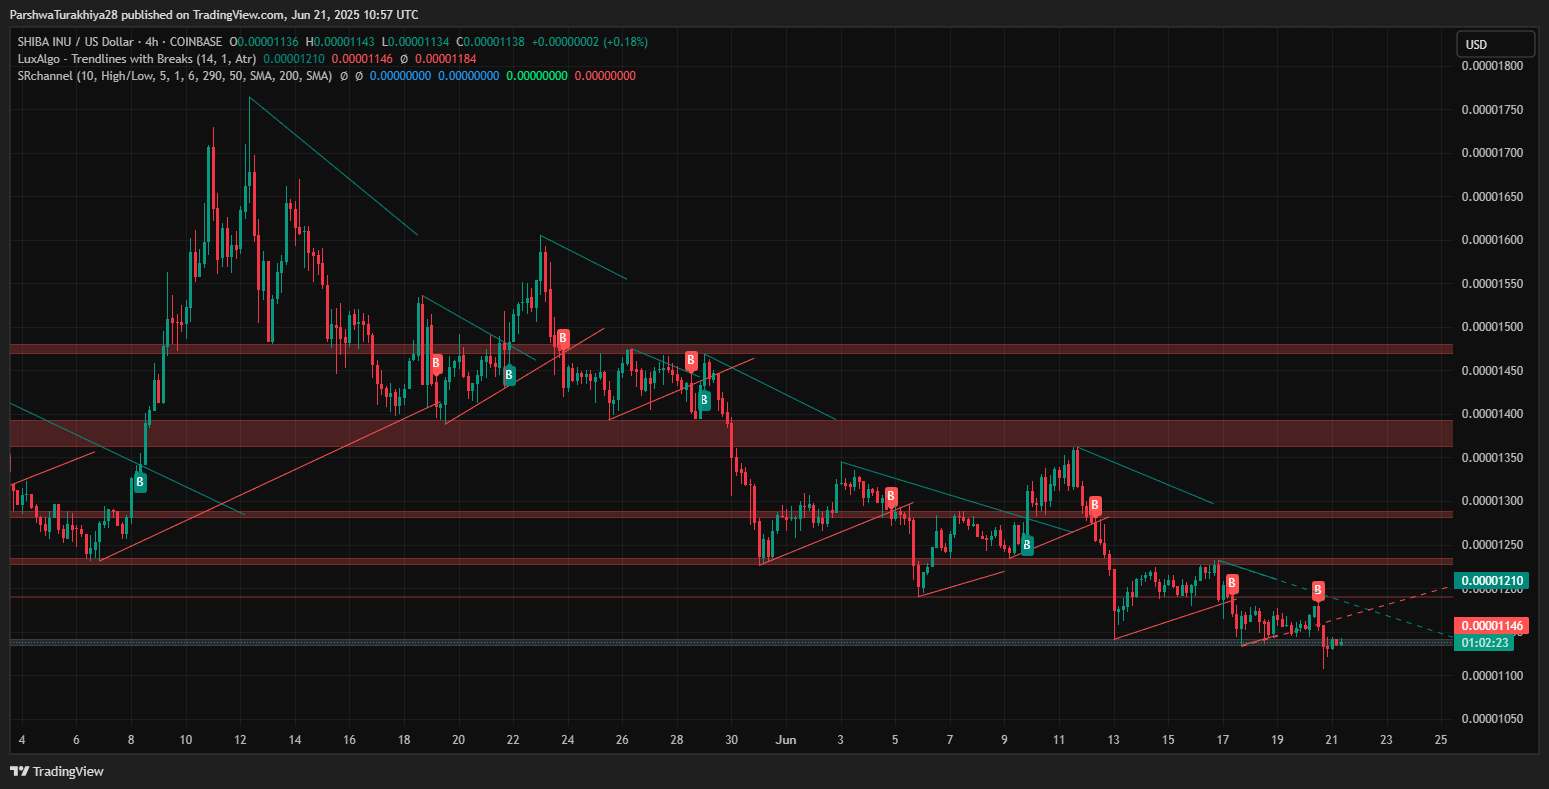
On the 4-hour chart, the Bollinger Bands have tightened significantly, with the price currently hugging the lower band. SHIB is also facing a strong cluster of EMAs: the 20 EMA ($0.00001155), 50 EMA ($0.00001181), and 100 EMA ($0.00001224), all stacked bearishly. A clean breakout above this EMA band is required for any shift in momentum.
The pivot structure further shows how tightly rangebound SHIB has become, with support marked at S4 ($0.00001082) and resistance at R3 ($0.00001265). The price is currently trading close to the S3 pivot point at $0.00001143 — a level that has been tested multiple times over the past 48 hours.
The trendline indicator confirms multiple bearish breaks, with SHIB repeatedly failing to sustain above wedge structures, particularly on the 4H and 30-minute charts. At present, the active channel suggests any move below $0.00001120 could expose SHIB to deeper losses toward the $0.00001080–$0.00001060 liquidity zone.
Momentum and Volume Indicators Show Bearish Bias Persisting
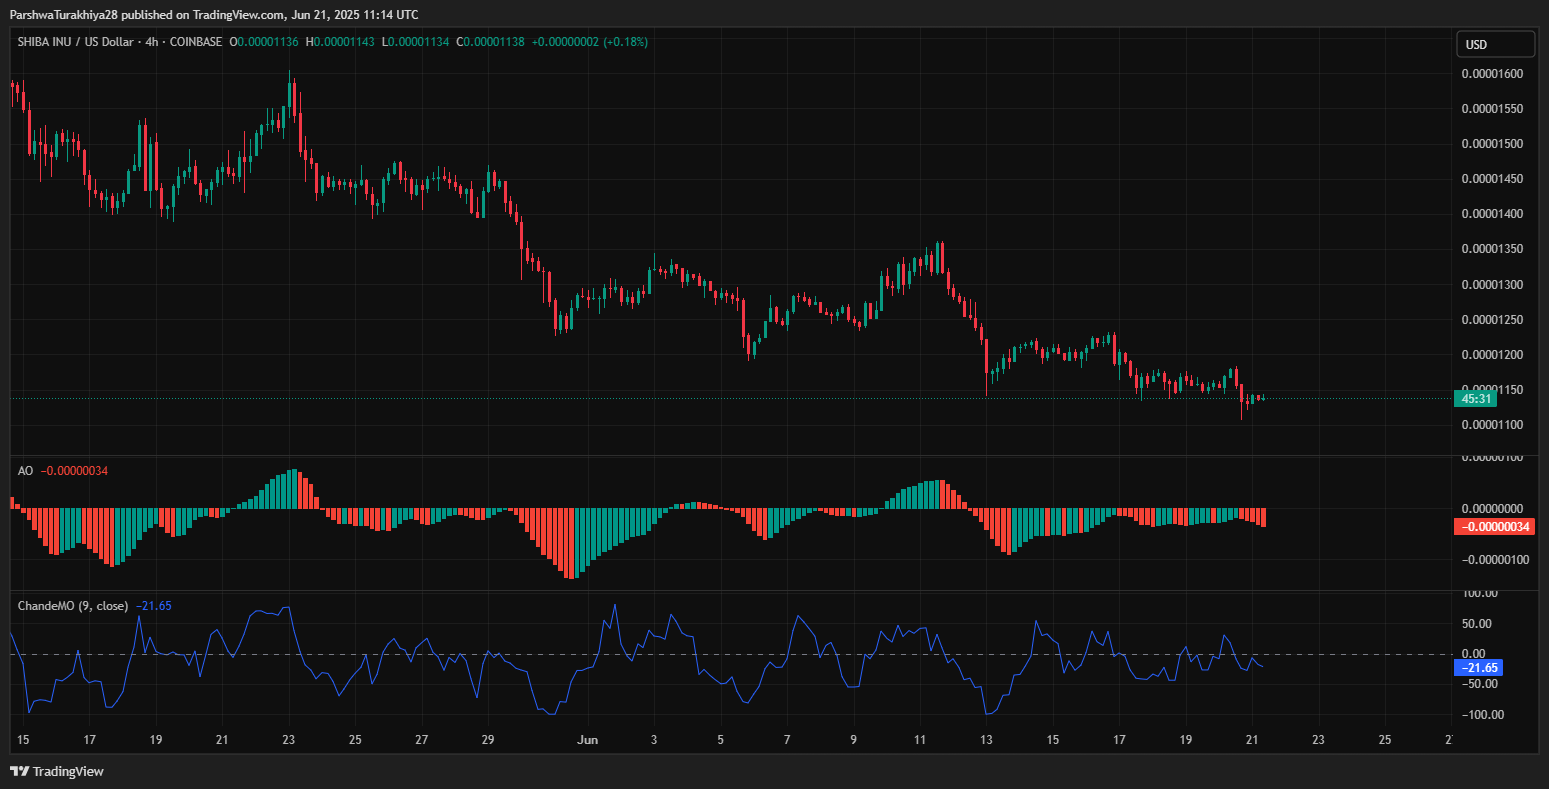
Momentum signals remain heavily skewed to the downside. The Awesome Oscillator (AO) continues to print red bars below the zero line, while the Chande Momentum Oscillator (ChandeMO) remains deep in negative territory at -21.65.
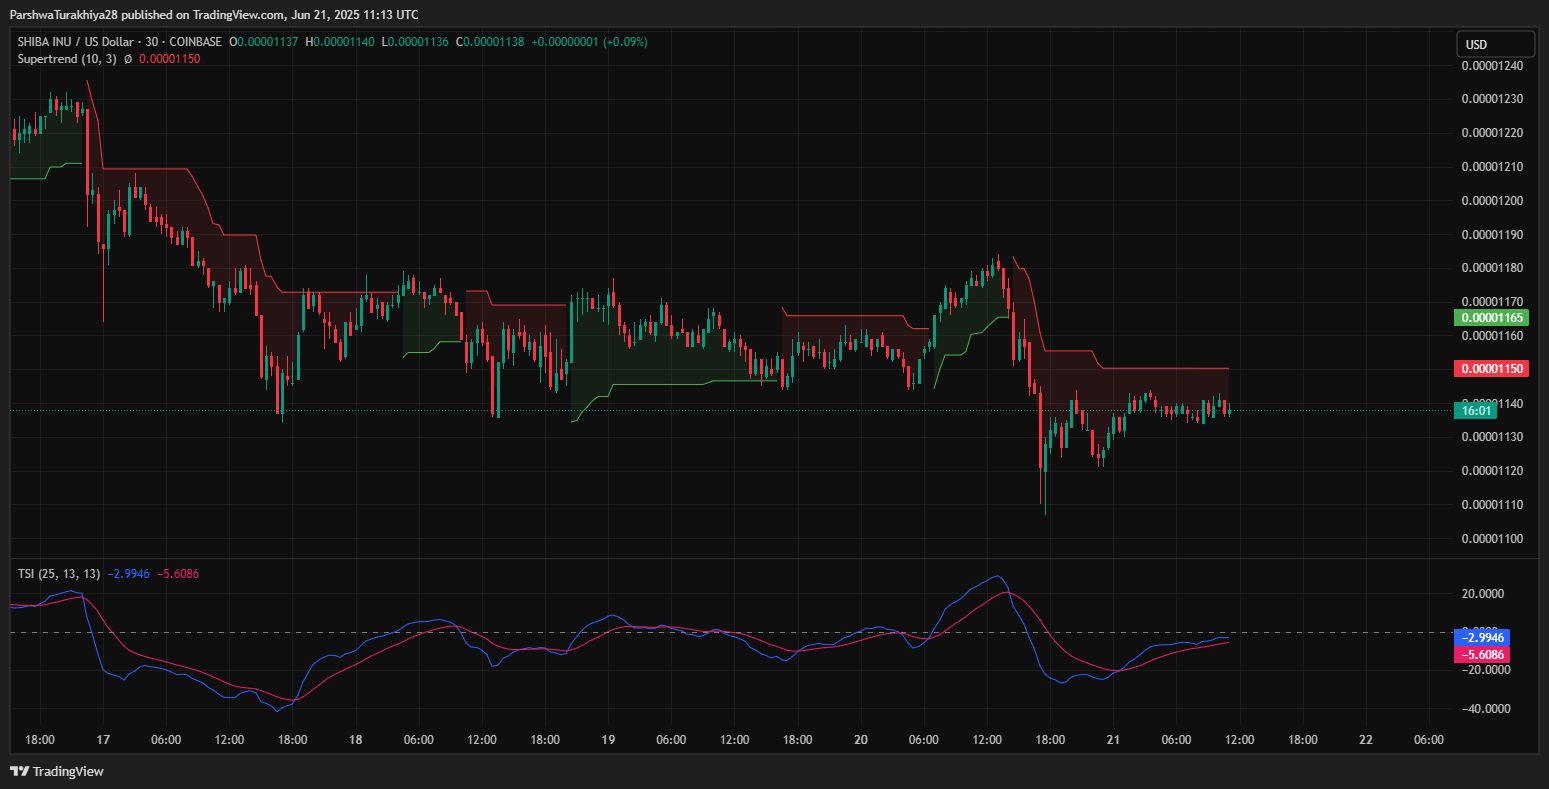
The True Strength Index (TSI) has dipped again, currently reading -2.99 against -5.60 — indicating a weak attempt to reverse recent selling. Meanwhile, the Volume Index (VI) shows the bearish line (red) still holding slightly above the bullish line (blue), suggesting seller control is still active, albeit weakening.
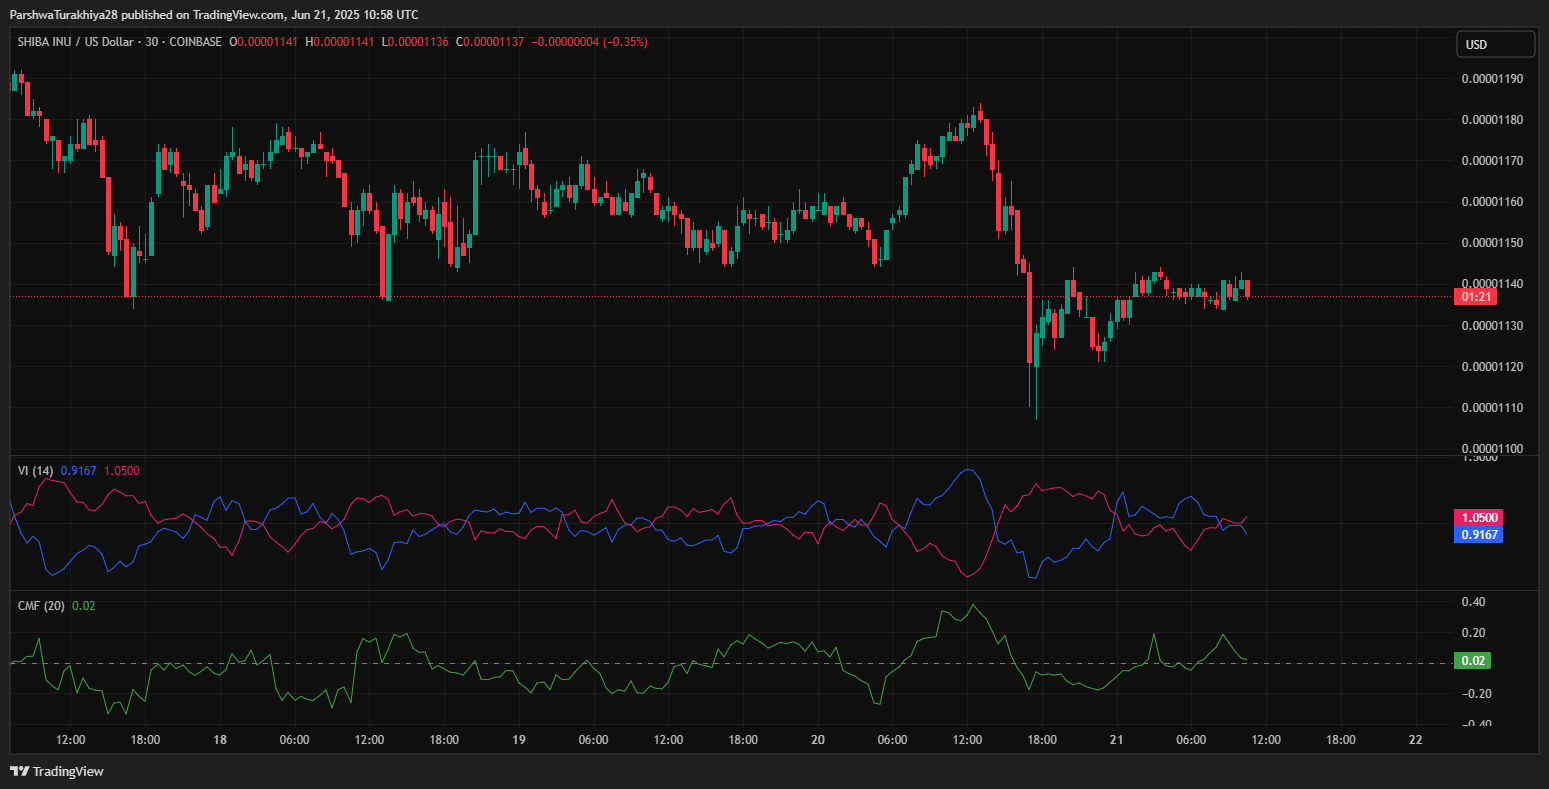
Chaikin Money Flow (CMF) is flat at +0.02, signaling minimal inflows and no strong accumulation yet. Combined, these indicators hint that although the selling has slowed, bulls lack conviction for a clear upside move.
Short-Term Outlook: Make-Or-Break Near $0.00001120
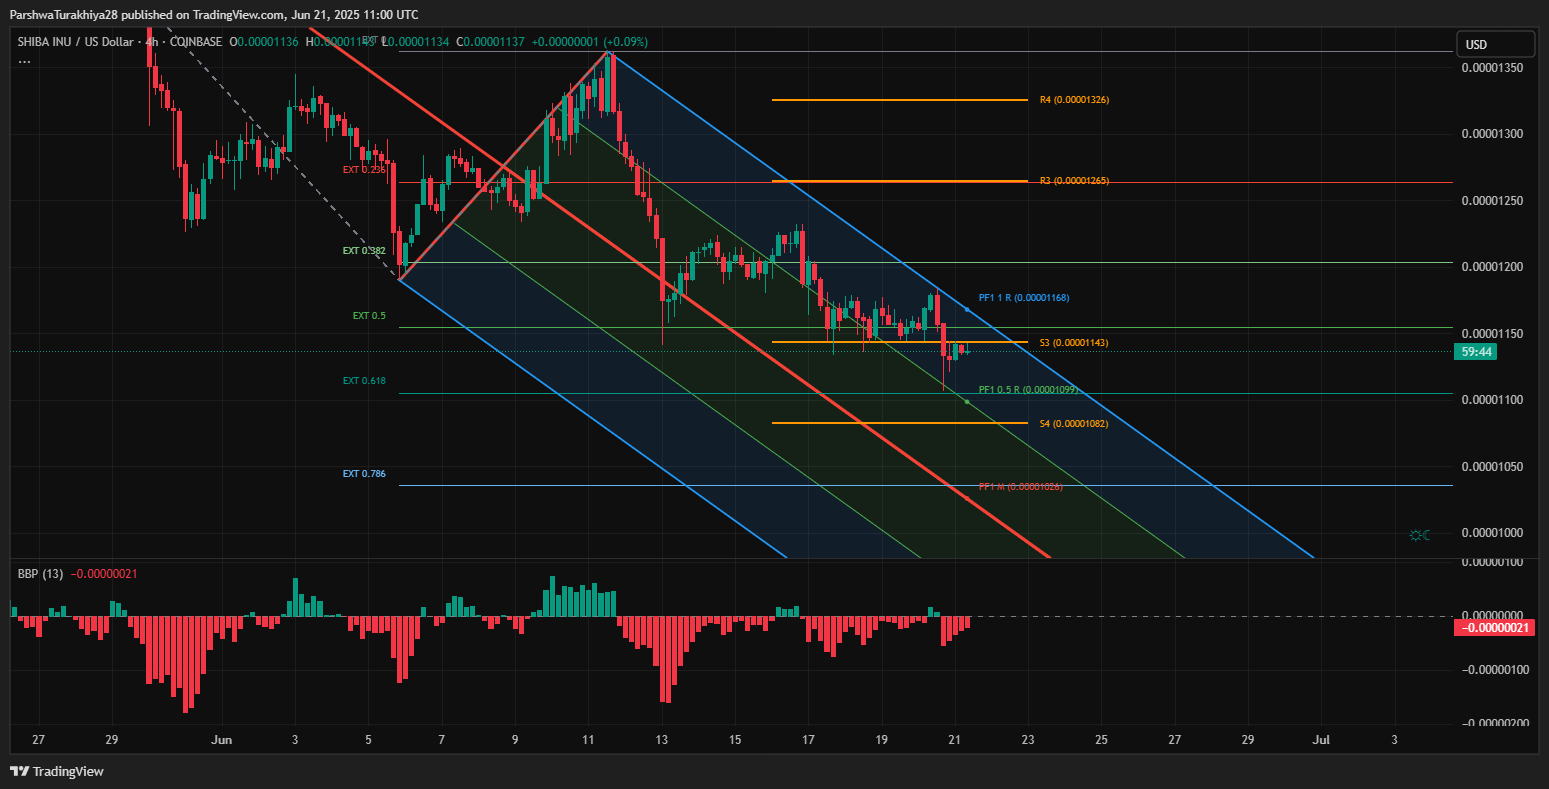
In the short term, the Shiba Inu price must hold above the $0.00001120 support to avoid accelerating losses. This zone not only acts as demand but also aligns with the 0.5 extension of the descending pitchfork and the lower Bollinger Band, forming a critical level for trend defense.
A failure to hold this area could open the door toward $0.00001080 and then $0.00001026 — the next key extension and major support. On the upside, if SHIB breaks above $0.00001150 with volume, bulls could aim for $0.00001224 and then $0.00001278 (200 EMA on 4H).
However, sentiment remains cautious, and until the EMAs are reclaimed and volume spikes, short-term rallies are likely to face strong selling into resistance.
SHIB Price Forecast Table: June 22
| Indicator/Zone | Level (USD) | Signal |
| Resistance 1 | 0.00001150 | Pivot + Supertrend barrier |
| Resistance 2 | 0.00001224–0.00001278 | EMA cluster + 200 EMA |
| Support 1 | 0.00001120 | Demand zone + Pitchfork support |
| Support 2 | 0.00001082 | Pivot S4 + lower channel |
| RSI (4H) | Sub-50 | Weak recovery momentum |
| TSI (30-min) | -2.99 / -5.60 | Downtrend continuation |
| ChandeMO | -21.65 | Strong bearish momentum |
| CMF (30-min) | +0.02 | Neutral — lack of inflow |
| AO (4H) | Red bars | Sustained bearish bias |
| BB (4H) | Tight range | Imminent volatility expansion |
Disclaimer: The information presented in this article is for informational and educational purposes only. The article does not constitute financial advice or advice of any kind. Coin Edition is not responsible for any losses incurred as a result of the utilization of content, products, or services mentioned. Readers are advised to exercise caution before taking any action related to the company.


