
- SHIB trades near $0.00000885 as spot outflows shrink and buyers defend the $0.00000820–$0.00000850 support band.
- A rising channel on the 1 hour chart shows higher lows as intraday momentum stabilizes above the Supertrend.
- Downtrend remains intact with major EMAs acting as resistance, but a breakout above $0.00000900 could shift sentiment.
Shiba Inu price today trades near $0.00000885 after defending short term support and holding inside a rising channel that has guided the rebound since November 23. The move stabilizes sentiment after weeks of steady selling and positions SHIB for a possible test of higher resistance levels if buyers maintain control. Spot outflows remain negative but have slowed sharply, reducing immediate pressure on the trend.
Downtrend Intact On Higher Timeframes As SHIB Tests Long Term Resistance
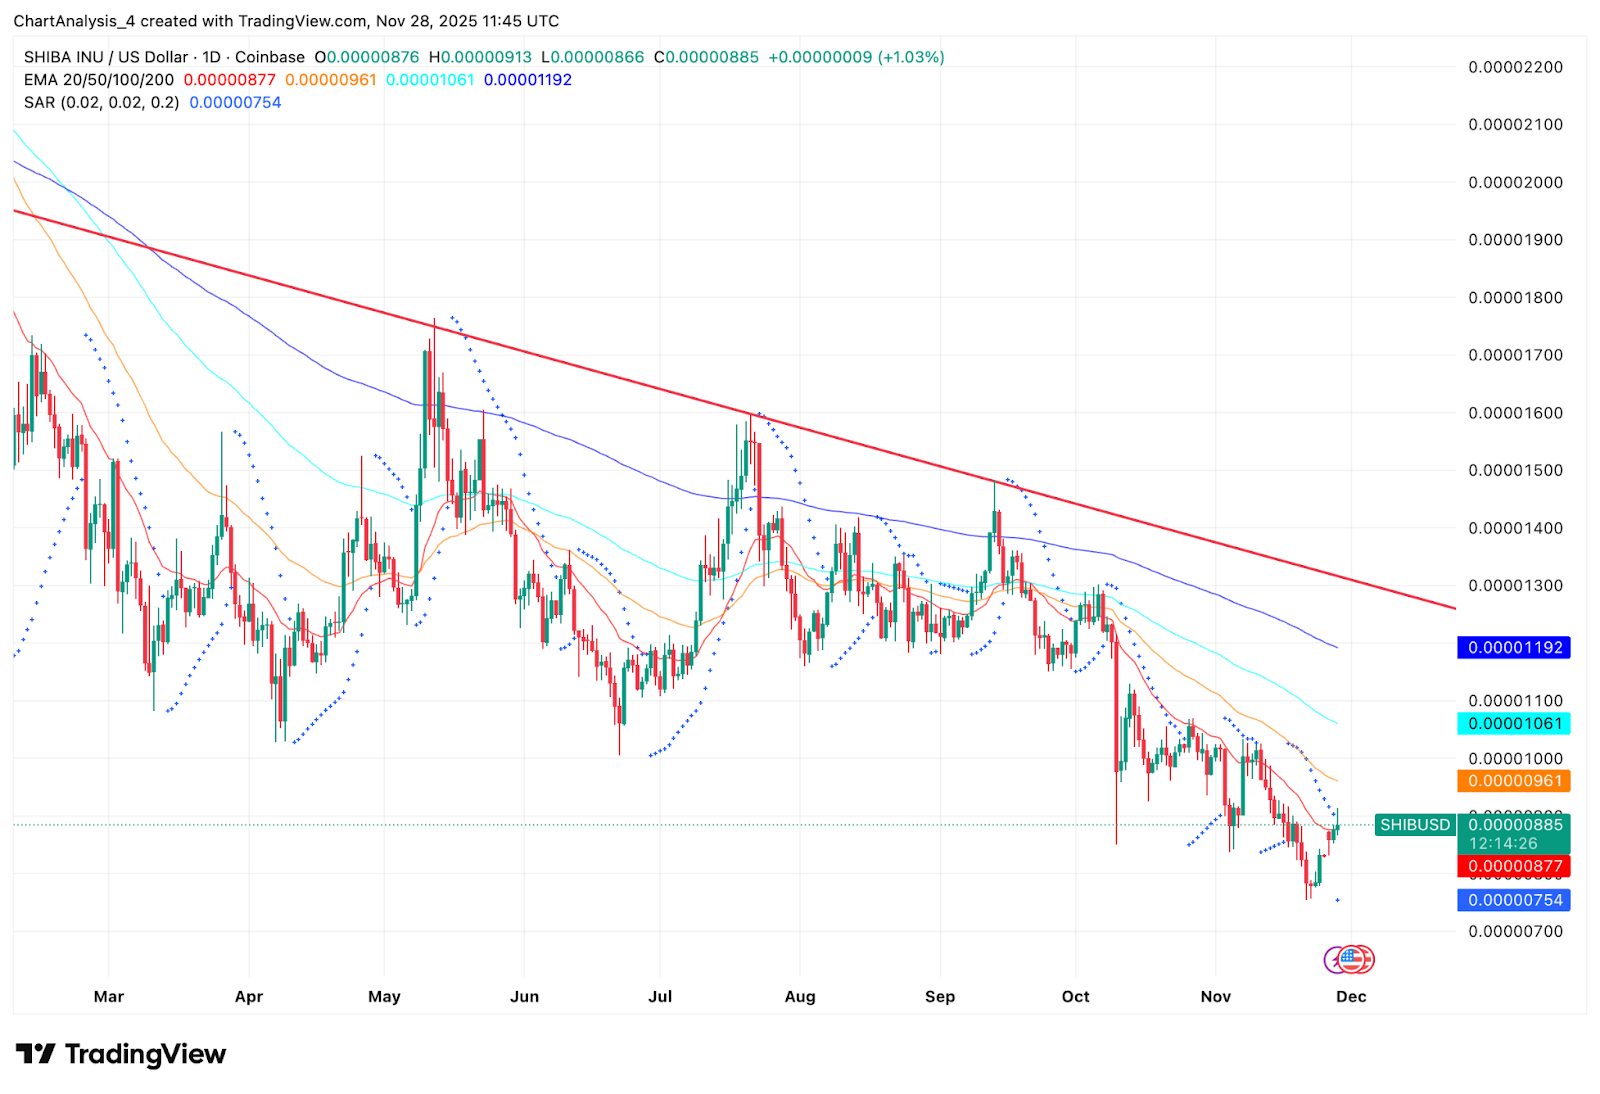
The daily chart continues to show a clear downtrend. SHIB has traded below its descending red trendline since March, and each rally toward that line has resulted in rejection. The upper boundary of the trendline now sits near $0.00001192 and remains the key structural barrier.
All major EMAs also lean bearish. The 20 day EMA is positioned at $0.00000877, the 50 day EMA at $0.00000961, the 100 day EMA at $0.00001061, and the 200 day EMA at $0.00001192. This full EMA cluster creates a multi-layer ceiling that SHIB must break to reverse the broader pattern. The Parabolic SAR reinforces the bearish view, with SAR dots still positioned above price on the daily timeframe.
Related: XRP Price Prediction: Market Tightens as XRP Approaches Key Breakout Zone
Despite this, the latest bounce from multi-month lows shows that buyers are stepping in near the $0.00000820 to $0.00000850 support zone. This area has attracted demand multiple times since September and remains the strongest short term base for SHIB.
Spot Outflows Slow As Selling Pressure Cools
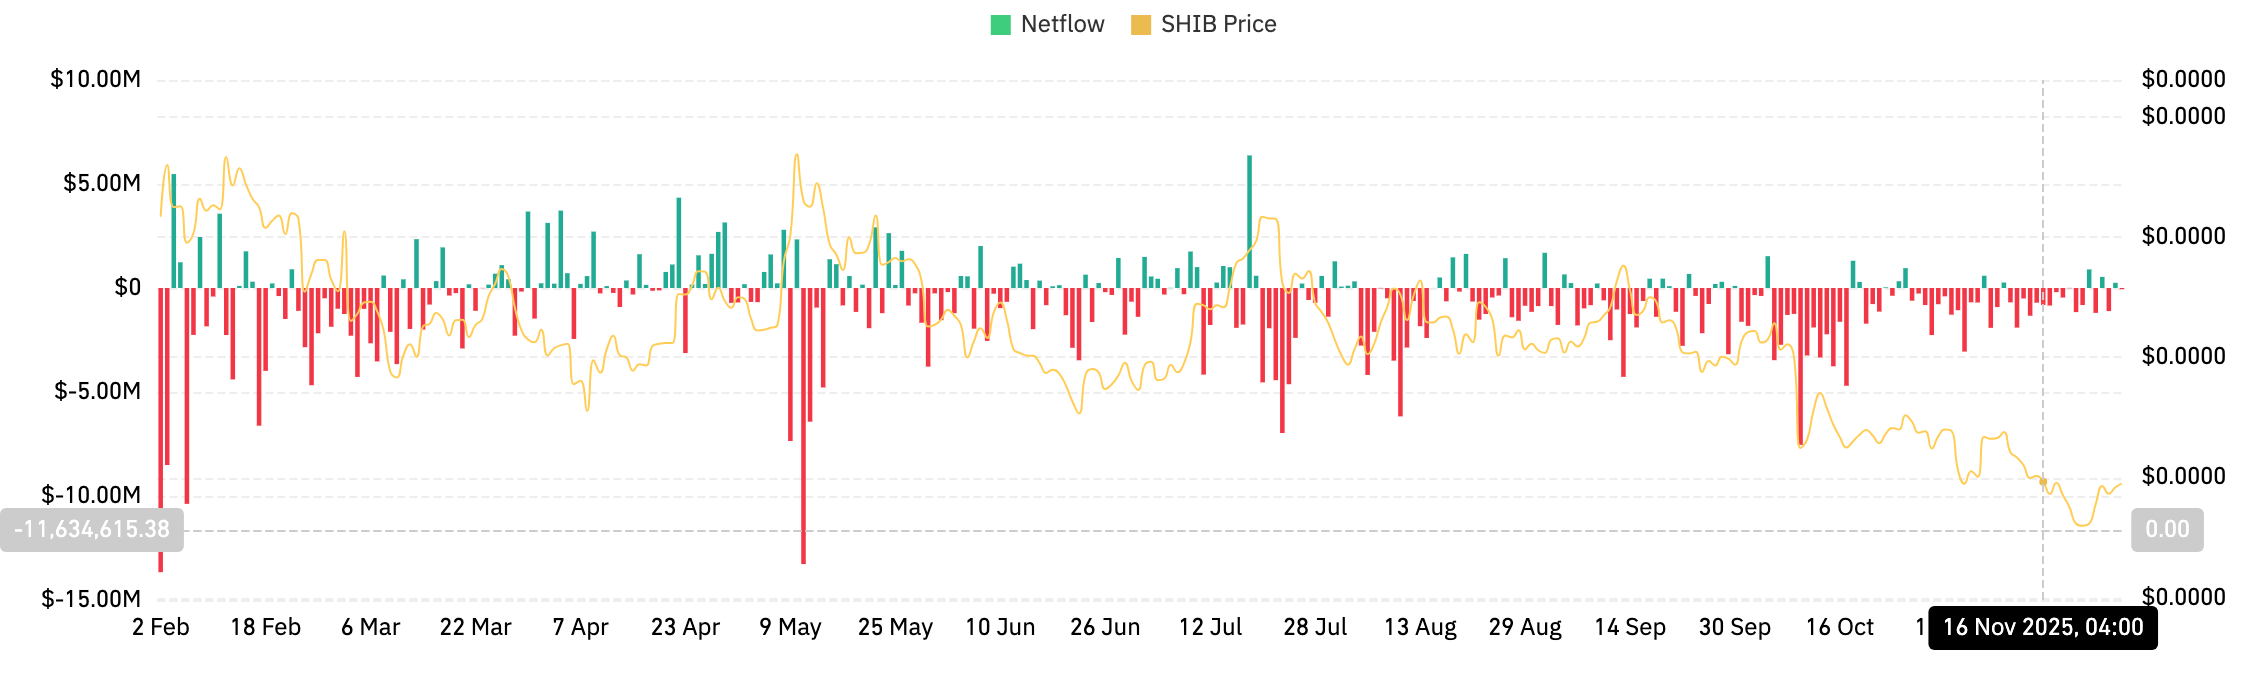
Coinglass data shows a net outflow of only $157,690 on November 28. That figure contrasts with the deeper outflows earlier in the year that often exceeded $5 million in a single session. While this still reflects distribution, the reduced scale suggests sellers are no longer dominating the tape.
This cooling pressure does not confirm accumulation, but it does reduce the risk of another impulsive drop. When outflows slow and price respects support, markets often shift toward balanced conditions where range formation becomes likely.
Rising Channel Holds As SHIB Builds Higher Lows
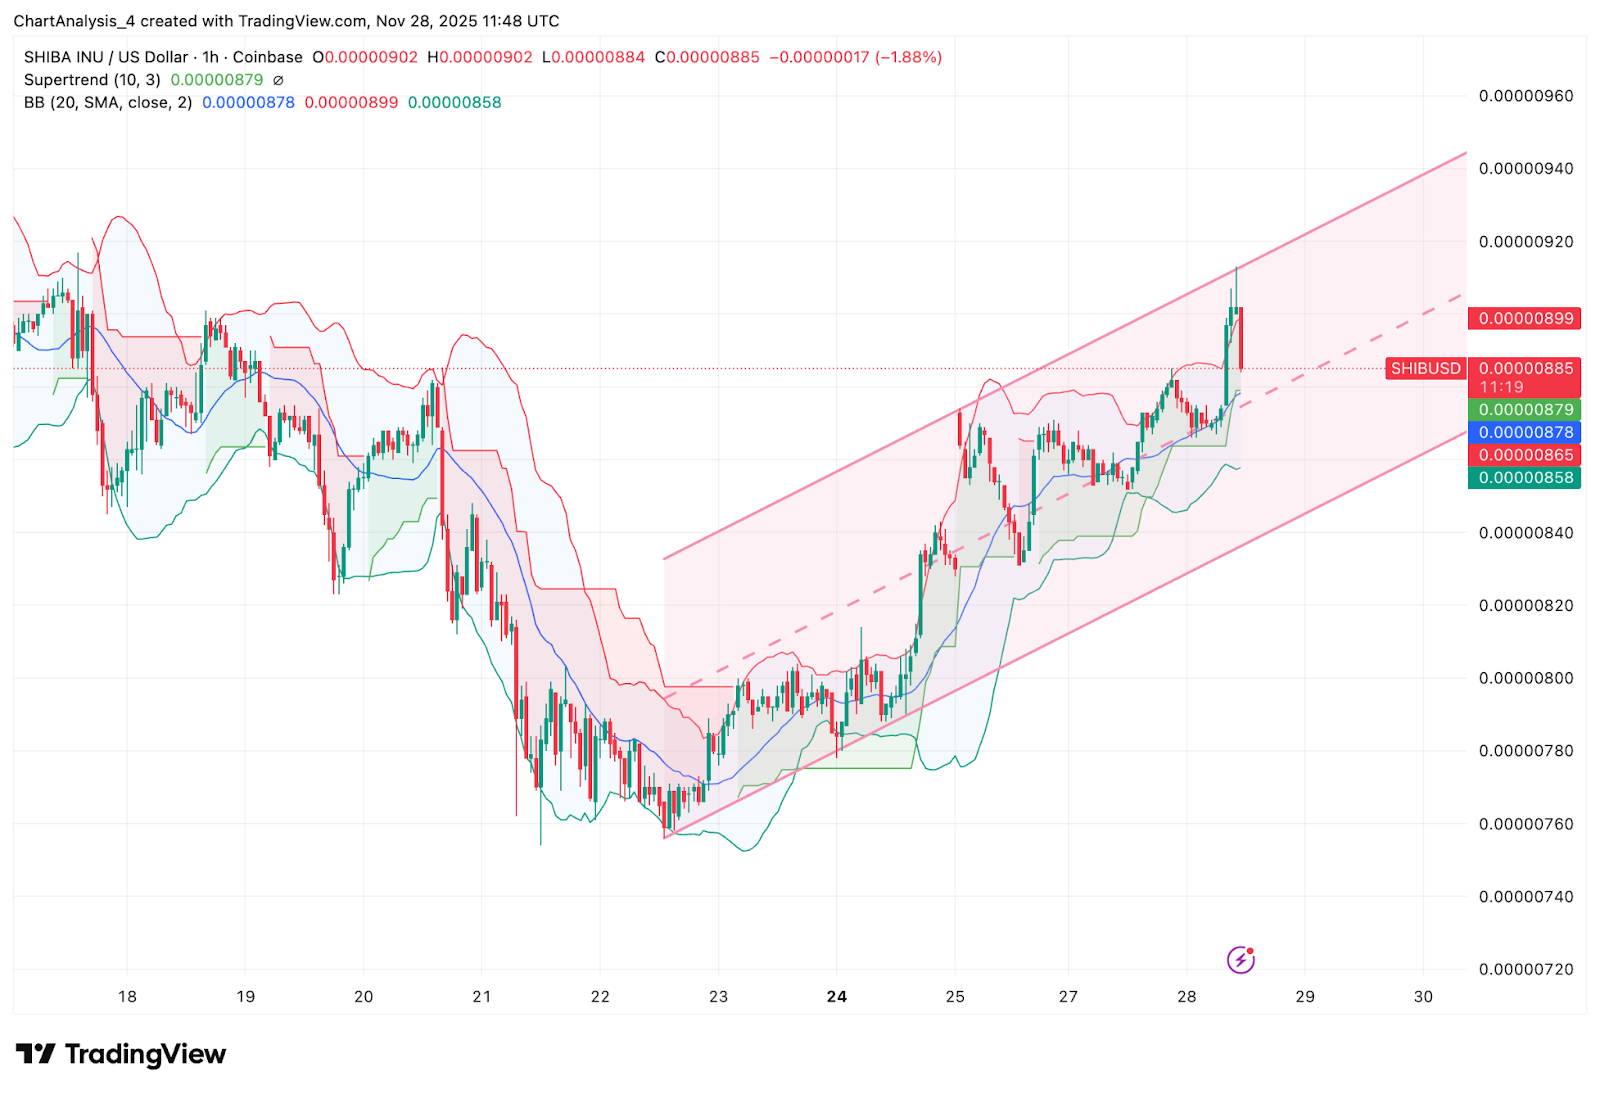
The clearest structure appears on the 1 hour chart. SHIB trades firmly inside a rising channel stretching from $0.00000800 toward $0.00000920. The lower boundary has held each intraday dip, while the upper boundary continues to cap momentum near $0.00000900.
Related: Pi Price Prediction: Market Watches Pullback as Supply Unlock Approaches
The latest rejection from the channel top aligns with a minor overextension above the Bollinger Band. Price has since returned to the median band, a normal reset that keeps the structure intact. The Supertrend is green on the 1 hour timeframe, holding at $0.00000879 and signaling that buyers still control intraday direction.
RSI remains balanced near 55, showing steady momentum without overheating. This combination of higher lows, channel support, and stable intraday indicators suggests that SHIB may attempt another move toward the upper boundary if volume improves.
Outlook. Will Shiba Inu Go Up?
The outlook hinges on SHIB’s ability to maintain the rising channel and challenge the EMA cluster overhead.
- Bullish case: A breakout above $0.00000900 followed by a close over $0.00000961 would confirm buyer strength. This opens the path toward $0.00001100, where the long term trendline waits. Clearing that level would signal a stronger trend reversal.
- Bearish case: A drop below $0.00000840 exposes $0.00000820 and risks a deeper move toward $0.00000754, which would shift SHIB back into a heavy distribution phase.
Related: Ethereum Price Prediction: Rising Channel Hints at Ethereum Recovery
Disclaimer: The information presented in this article is for informational and educational purposes only. The article does not constitute financial advice or advice of any kind. Coin Edition is not responsible for any losses incurred as a result of the utilization of content, products, or services mentioned. Readers are advised to exercise caution before taking any action related to the company.
 Price Prediction for April 2026: Will Chainlink Move Higher?")
 Price Prediction: Can Bulls Sustain the $0.045 Push?")


