
- SHIB stays below all key EMAs as sellers cap rallies and pressure near-term support.
- Support at $0.00000760 is critical, with a break risking a slide toward $0.00000730.
- Burns add long-term scarcity, but weak spot demand and cautious leverage limit upside.
Shiba Inu continues to trade under pressure as the 4-hour chart signals a bearish-to-neutral structure. Price action remains capped beneath key moving averages, keeping sellers in control. Consequently, traders now focus on whether SHIB can defend near-term support or risk a deeper slide.
Price Structure Signals Limited Upside
SHIB trades below its 20, 50, 100, and 200-period EMAs on the 4-hour chart. This alignment reflects sustained downside pressure. Moreover, each rebound has stalled near the EMA cluster, reinforcing seller dominance. Parabolic SAR signals also favor the downside, as dots continue to print above price.
Immediate support sits near $0.00000760, which now acts as a key pivot. Besides, buyers previously defended this level during minor rebounds. A failure here exposes the $0.00000750 to $0.00000745 demand zone.
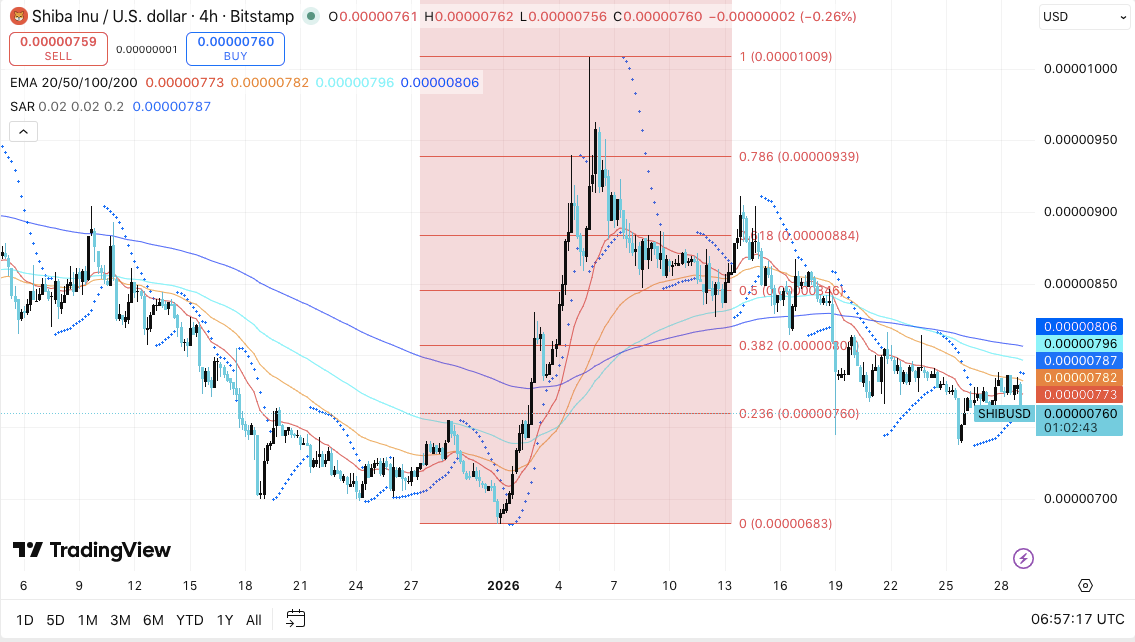
Consequently, a decisive break could trigger a move toward $0.00000730. Analysts flag $0.00000683 as a major swing low, where buyers may attempt stronger defense.
On the upside, resistance begins near $0.00000773 to $0.00000782, where EMA pressure concentrates. Additionally, $0.00000796 marks a prior consolidation area. A sustained recovery requires acceptance above $0.00000826, the 0.5 Fibonacci level. Significantly, $0.00000884 remains a critical barrier, as trend reversal needs firm closes above that zone.
Derivatives and Spot Flows Reflect Caution
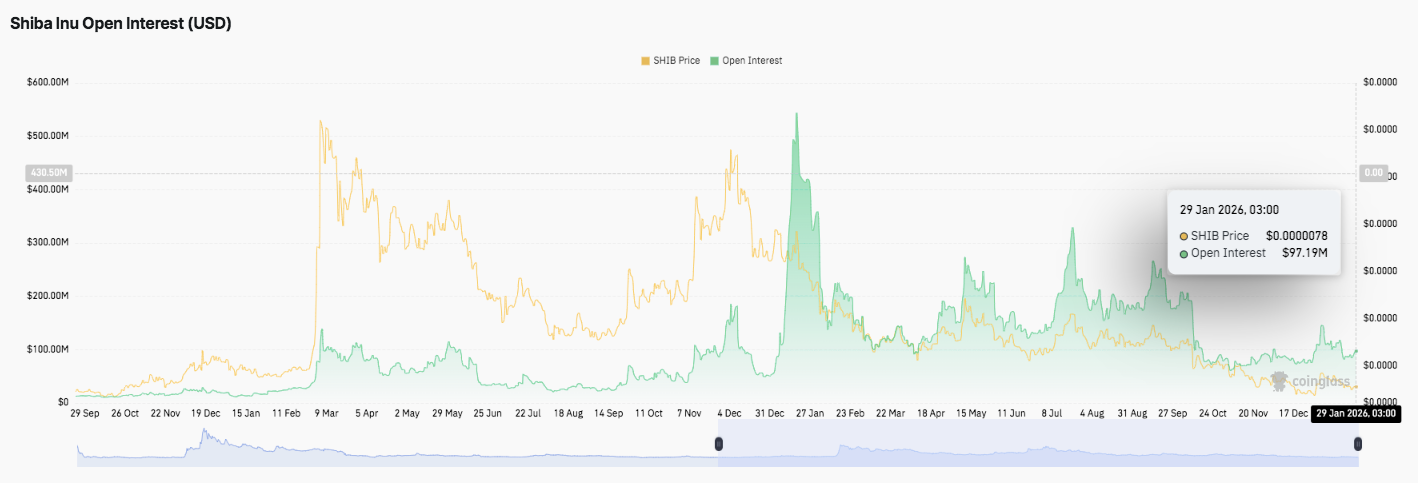
Open interest trends show repeated expansion and contraction cycles. Early accumulation phases preceded sharp rallies, driven by leverage. However, interest consistently unwound after peaks, signaling reduced risk appetite.
Recently, open interest stabilized at lower levels than past extremes. The latest rise toward $97 million suggests renewed speculation. Still, leverage rebuilds gradually rather than aggressively.
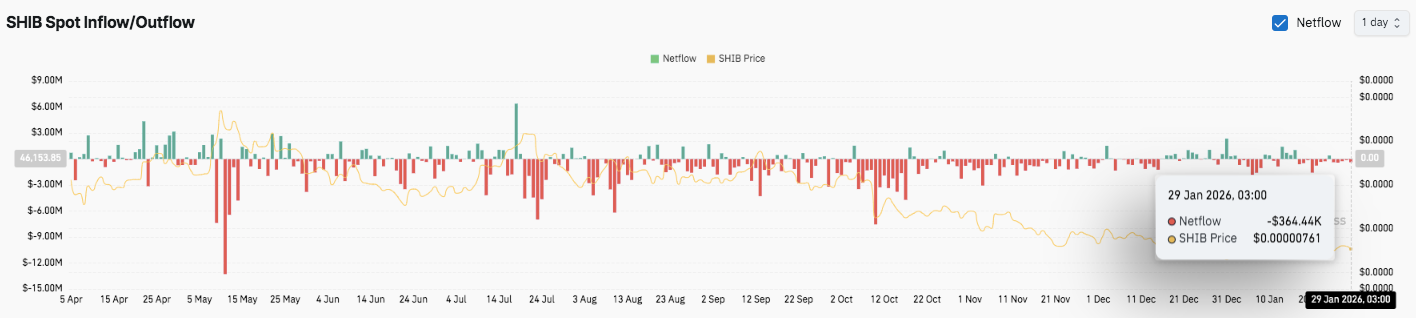
Spot flow data continues to lean bearish. Net outflows dominate most periods, reflecting ongoing distribution. Several outflow spikes aligned with accelerated selloffs during previous months.
Related: Solana Price Prediction: WisdomTree RWA Expansion Meets Critical Trendline Test
Moreover, inflows remain shallow and short-lived. From October onward, selling pressure appears controlled, not panicked. However, persistent negative netflows into late January signal weak demand recovery.
Burn Activity Adds a Deflationary Angle
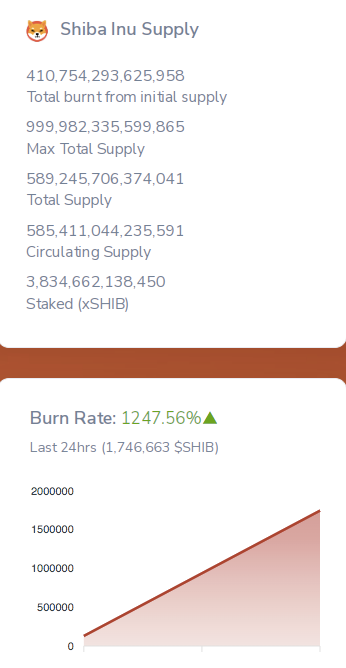
Token supply metrics show continued reductions from ongoing burns. To date, burns removed 410.75 trillion SHIB permanently. Current total supply now stands near 589.25 trillion SHIB. Circulating supply remains high at 585.41 trillion SHIB. Additionally, 3.83 trillion SHIB remains staked as xSHIB, limiting immediate liquidity.
Burn activity surged sharply in the past 24 hours. The burn rate jumped over 1,200%, removing roughly 1.75 million SHIB. While burns support long-term scarcity, price direction still depends on demand strength. Hence, SHIB remains vulnerable unless buyers reclaim key resistance levels decisively.
Technical Outlook for Shiba Inu Price Heading Into February
Key levels remain tightly defined as Shiba Inu moves from late January into February, with price action showing compression after an extended decline. SHIB continues to trade below major moving averages, keeping short-term momentum cautious. However, the narrowing range suggests volatility could expand as February approaches.
- Upside levels: Immediate resistance sits at $0.00000782, followed by $0.00000796. A clean breakout above these zones could open a recovery toward $0.00000826. Beyond that, $0.00000884 remains the critical resistance level to flip for a broader trend shift.
- Downside levels: On the downside, $0.00000760 acts as the key near-term pivot. Holding this level keeps the structure stable. A break below $0.00000750 exposes $0.00000730, with $0.00000683 standing as the major downside target and cycle support.
- Resistance ceiling: The $0.00000826 region, aligned with the 0.5 Fibonacci retracement, represents the primary level bulls must reclaim to restore medium-term momentum. Acceptance above $0.00000884 would signal a meaningful change in trend structure.
Technically, SHIB appears to be compressing within a declining range, reflecting balance between cautious buyers and persistent sellers. This structure often precedes volatility expansion, particularly as liquidity returns after January positioning.
Will Shiba Inu Break Direction in February?
Shiba Inu’s February outlook depends on whether buyers can continue defending the $0.00000760 base while building momentum toward the $0.00000782–$0.00000826 resistance cluster.
Stabilizing open interest and controlled spot outflows suggest selling pressure is no longer aggressive. Consequently, any improvement in inflows could support a short-term recovery attempt.
However, failure to hold $0.00000750 would weaken the structure and shift focus toward deeper supports. For now, SHIB trades in a pivotal zone. January’s consolidation sets the stage, but February’s volume and conviction will likely decide the next directional move.
Disclaimer: The information presented in this article is for informational and educational purposes only. The article does not constitute financial advice or advice of any kind. Coin Edition is not responsible for any losses incurred as a result of the utilization of content, products, or services mentioned. Readers are advised to exercise caution before taking any action related to the company.


 Price Prediction: Canton Eyes Key Break After Market Activity Spike")

