
- Shiba Inu trades near $0.00001007, holding above support but still below the descending trendline.
- SHIB remains under all major EMAs, creating a dense resistance cluster that sellers continue to defend.
- Supertrend flipped bullish, and RSI near 55 signals improving momentum and a potential short-term uptrend.
Shiba Inu holds $0.00001007 after a sharp rebound from multi-month support, yet sellers still control the market as price presses into a heavy resistance cluster. Shiba Inu reacted strongly from the horizontal support zone near 0.00000980–$0.00000985.
This level continues to show demand. Each time the price has approached it, buyers have stepped up with conviction, preventing a breakdown into lower liquidity. As long as SHIB holds above this band, downside remains limited.
However, the rebound must now transition into continuation. The daily chart shows SHIB still trapped under a descending trendline stretching back to February. This trendline has rejected every major breakout attempt for months and currently sits near $0.00001260. Until price reclaims the trendline, the dominant trend remains downward.
EMA Cluster Creates Overhead Barrier
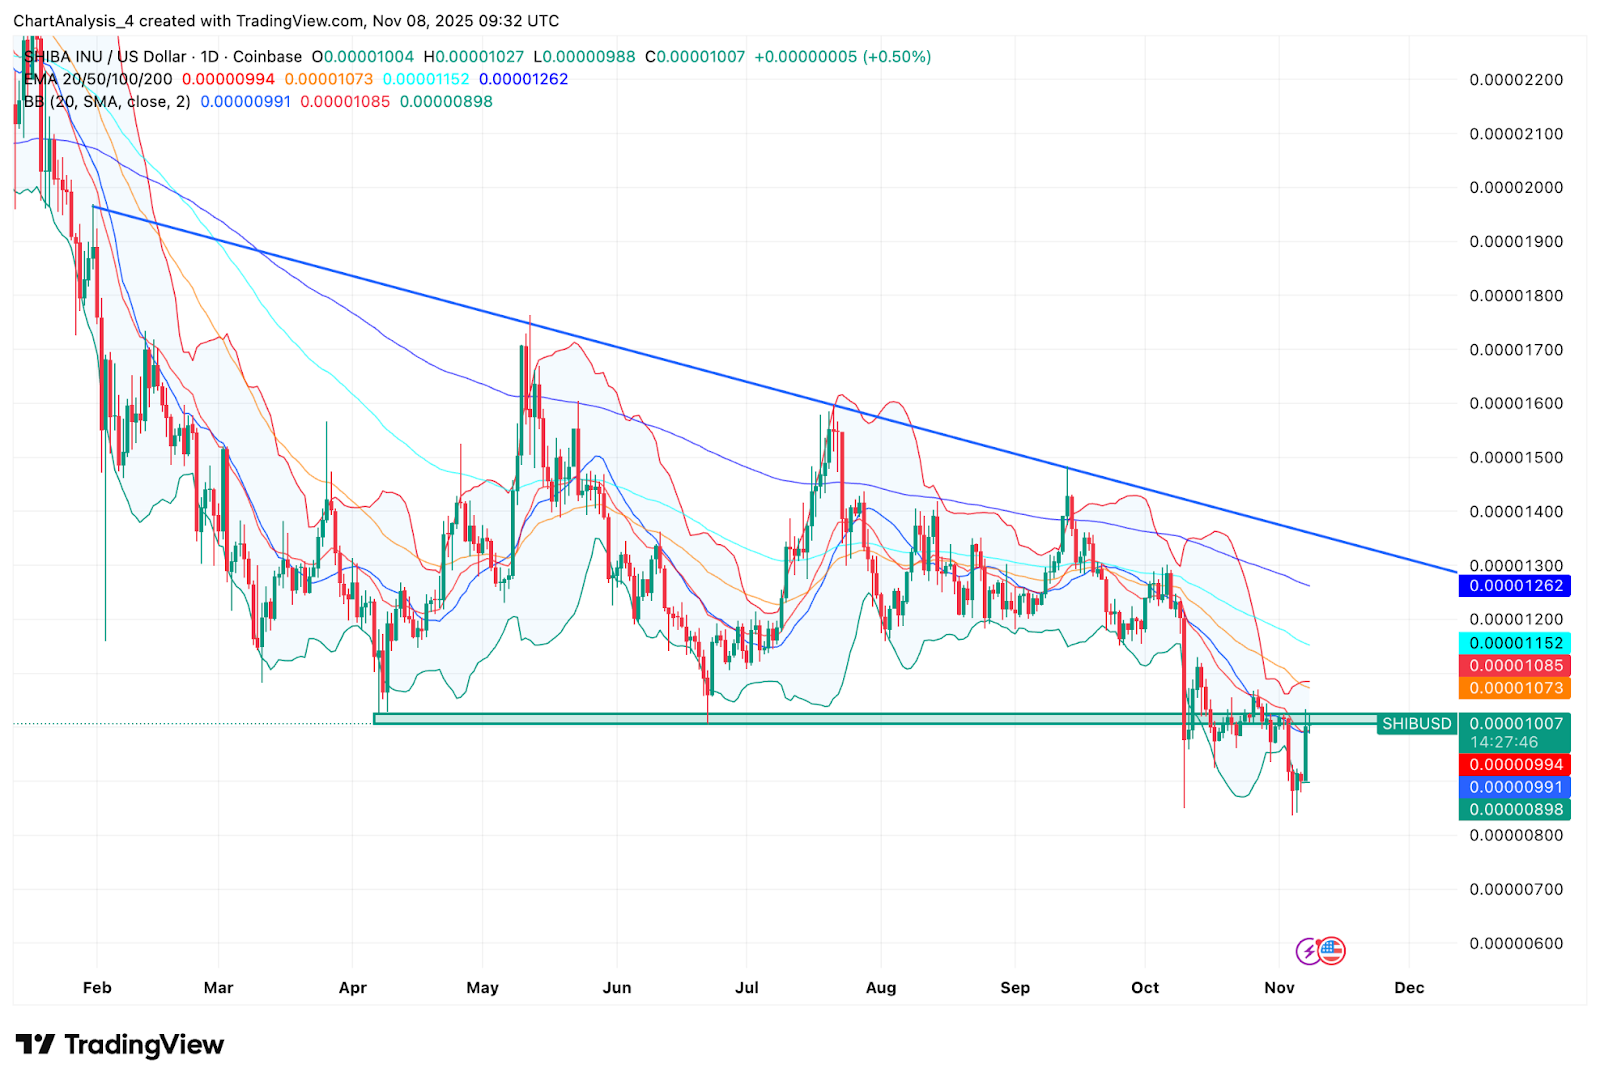
The technical challenge becomes clear when examining the moving averages.
- 20 day EMA: $0.00001085
- 50 day EMA: $0.00001152
- 100 day EMA: $0.00001173
- 200 day EMA: $0.00001262
Price is trading below all four EMAs, which are aligned downward and tightly compressed. This creates a dense resistance zone that often becomes a decision point for trend continuation or reversal.
Strong breakouts typically require volume expansion when moving into a compressed EMA cluster. Without that, rallies tend to stall. A daily close above the 20-day EMA would be the first sign that buyers are regaining momentum.
The Bollinger bands have narrowed, indicating price compression. Narrow bands often precede a directional breakout. The direction depends on how the price interacts with the EMA range.
Intraday Trend Turns Constructive
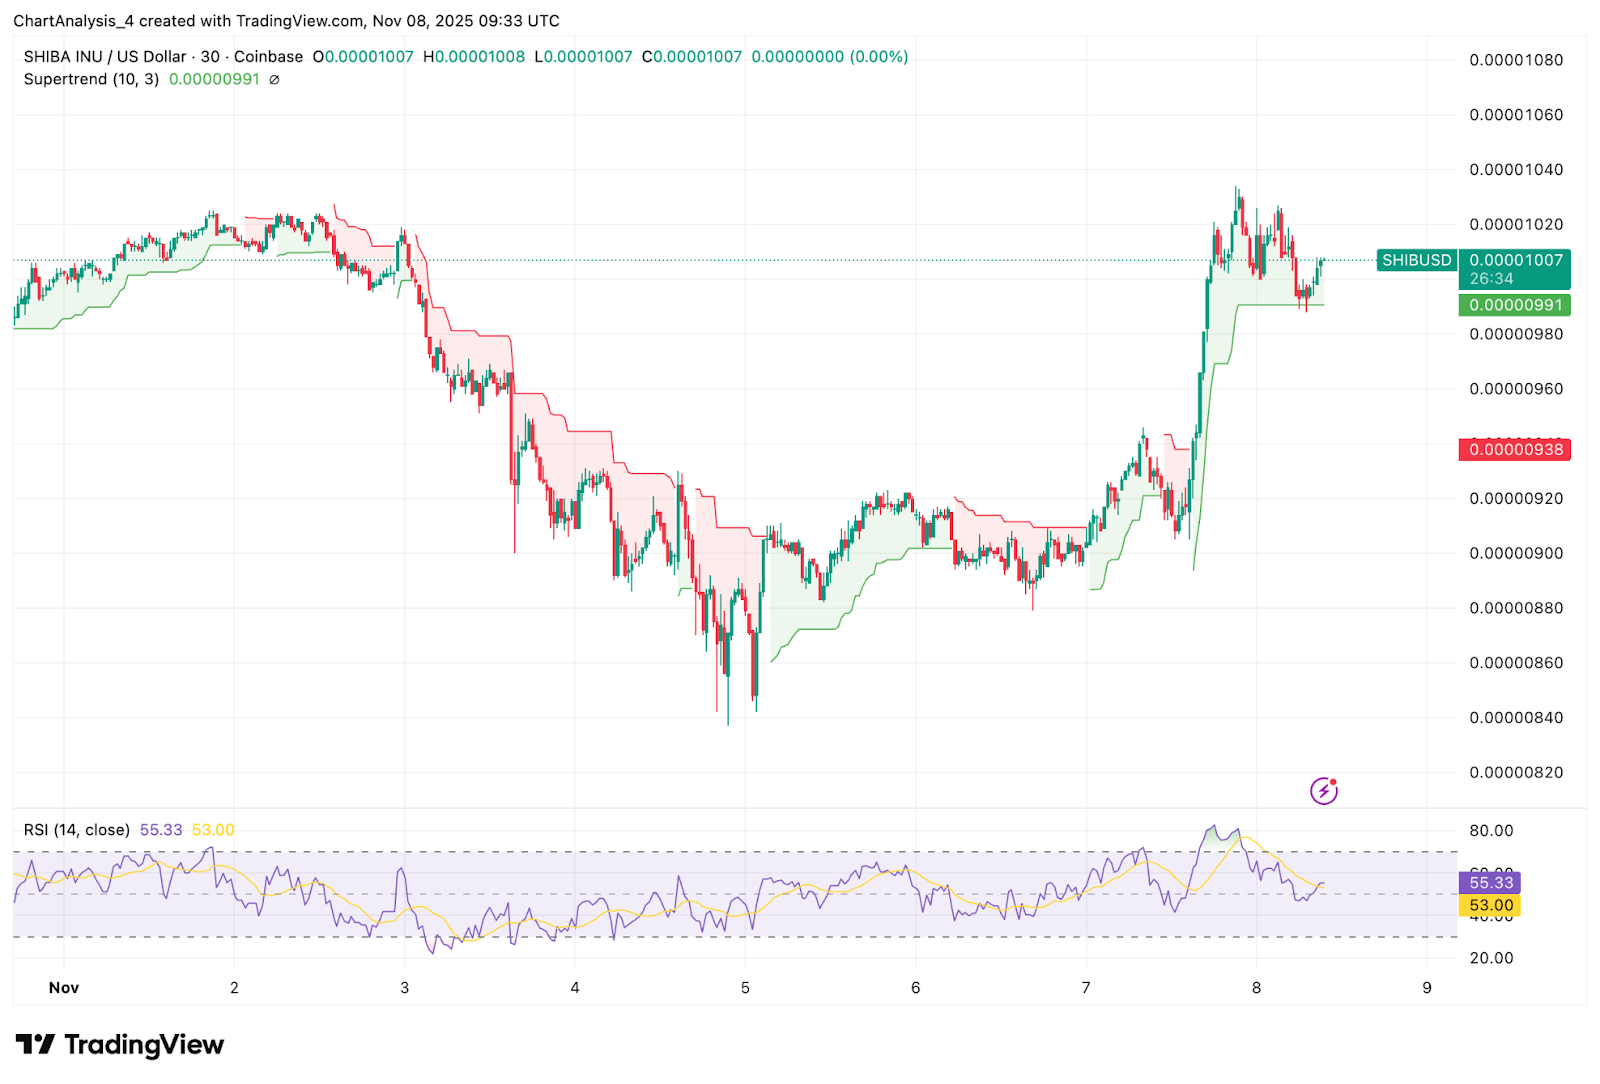
The 30-minute chart shows SHIB attempting to build short-term trend support.
- Supertrend flipped green
- RSI holds near 55, reflecting improved momentum
- Higher lows form a short-term rising structure
Price is currently holding above the Supertrend pivot near $0.00000991. Maintaining support at this level keeps intraday strength intact and prevents a retest of the lower demand zone.
Short-term traders are watching $0.00001020–$0.00001030, as a break above this intraday range opens a path to the first EMA challenge on the daily chart.
Will Shiba Inu Go Up?
Shiba Inu is showing strength where it needs to: at support.
- Bullish case: A daily close above $0.00001085 signals buyers are taking back control. Break above $0.00001152 and then $0.00001260 confirms a trend shift, targeting $0.00001380 and then $0.00001500.
- Bearish case: Failure to hold $0.00000980 puts price back into the lower liquidity zone. A breakdown exposes $0.00000940, followed by $0.00000880.
Disclaimer: The information presented in this article is for informational and educational purposes only. The article does not constitute financial advice or advice of any kind. Coin Edition is not responsible for any losses incurred as a result of the utilization of content, products, or services mentioned. Readers are advised to exercise caution before taking any action related to the company.


