 Poised for New All-Time Highs: A Trend Analysis")
- SHIB’s breakout from the descending trendline suggests bullish momentum ahead.
- Key support at $0.00001000 could stabilize $SHIB during potential pullbacks.
- Strong trading volume indicates heightened investor interest in $SHIB’s upward potential.
Shiba Inu ($SHIB) has shown signs of a potential all-time high (ATH). A crypto Analyst has highlighted breakout from a descending trendline, suggesting bullish reversal in price action.
Price Trend Analysis
The price movement of $SHIB/USDT reveals a consistent downward trend characterized by lower highs, depicted by a white descending trendline. This downward trajectory has raised concerns among investors about further declines.
However, the recent breakout above this trendline indicates a possible change in momentum, opening up opportunities for upward movement.
Read also: Shiba Inu Burn Rate Surges 700%, Price Rally Fueled by Kusama’s Remarks
Support and Resistance Levels
It is important to understand support and resistance levels to gauge future price movements. The previous low of $0.00001000 is a critical support level that could provide a base for buyers if the price retraces.
On the upside, there are several resistance levels, with immediate resistance at $0.00001707, where the price is facing selling pressure.
If the bullish momentum continues, traders may look toward higher resistance levels, with the next key resistance at $0.00004000. Beyond this, there is a significant resistance level at $0.00007000. Breaking through these levels could solidify $SHIB’s upward path.
Market Indicators and Outlook
The current market sentiment around Shiba Inu is relatively positive, with the live price sitting at $0.000017. Over the past 24 hours, $SHIB has experienced a notable increase of 12.66%, with a trading volume of $744,353,702. Such robust trading activity indicates strong interest among investors.
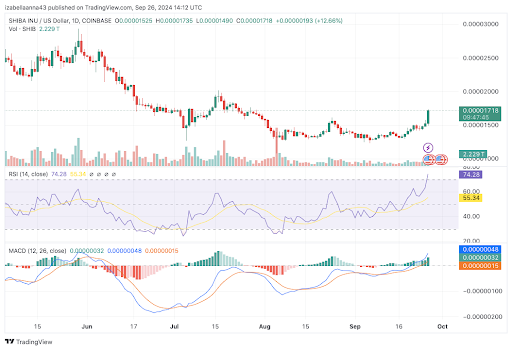
Market indicators support the bullish outlook. The 1-day Relative Strength Index (RSI) is 74.28, suggesting that $SHIB may be overbought in the short term. The 1-day Moving Average Convergence Divergence (MACD) is trading above the signal line, hinting at a potential price correction or pullback.
Disclaimer: The information presented in this article is for informational and educational purposes only. The article does not constitute financial advice or advice of any kind. Coin Edition is not responsible for any losses incurred as a result of the utilization of content, products, or services mentioned. Readers are advised to exercise caution before taking any action related to the company.


