 Price Prediction & Analysis for July 12")
After months of sideways movement, Shiba Inu price today is showing renewed upside strength. The asset has broken above a descending trendline that had capped its recovery efforts since March. At the time of writing, Shiba Inu price is holding steady near $0.00001334 with increased momentum from both technical breakout signals and favorable on-chain flows.
What’s Happening With Shiba Inu’s Price?
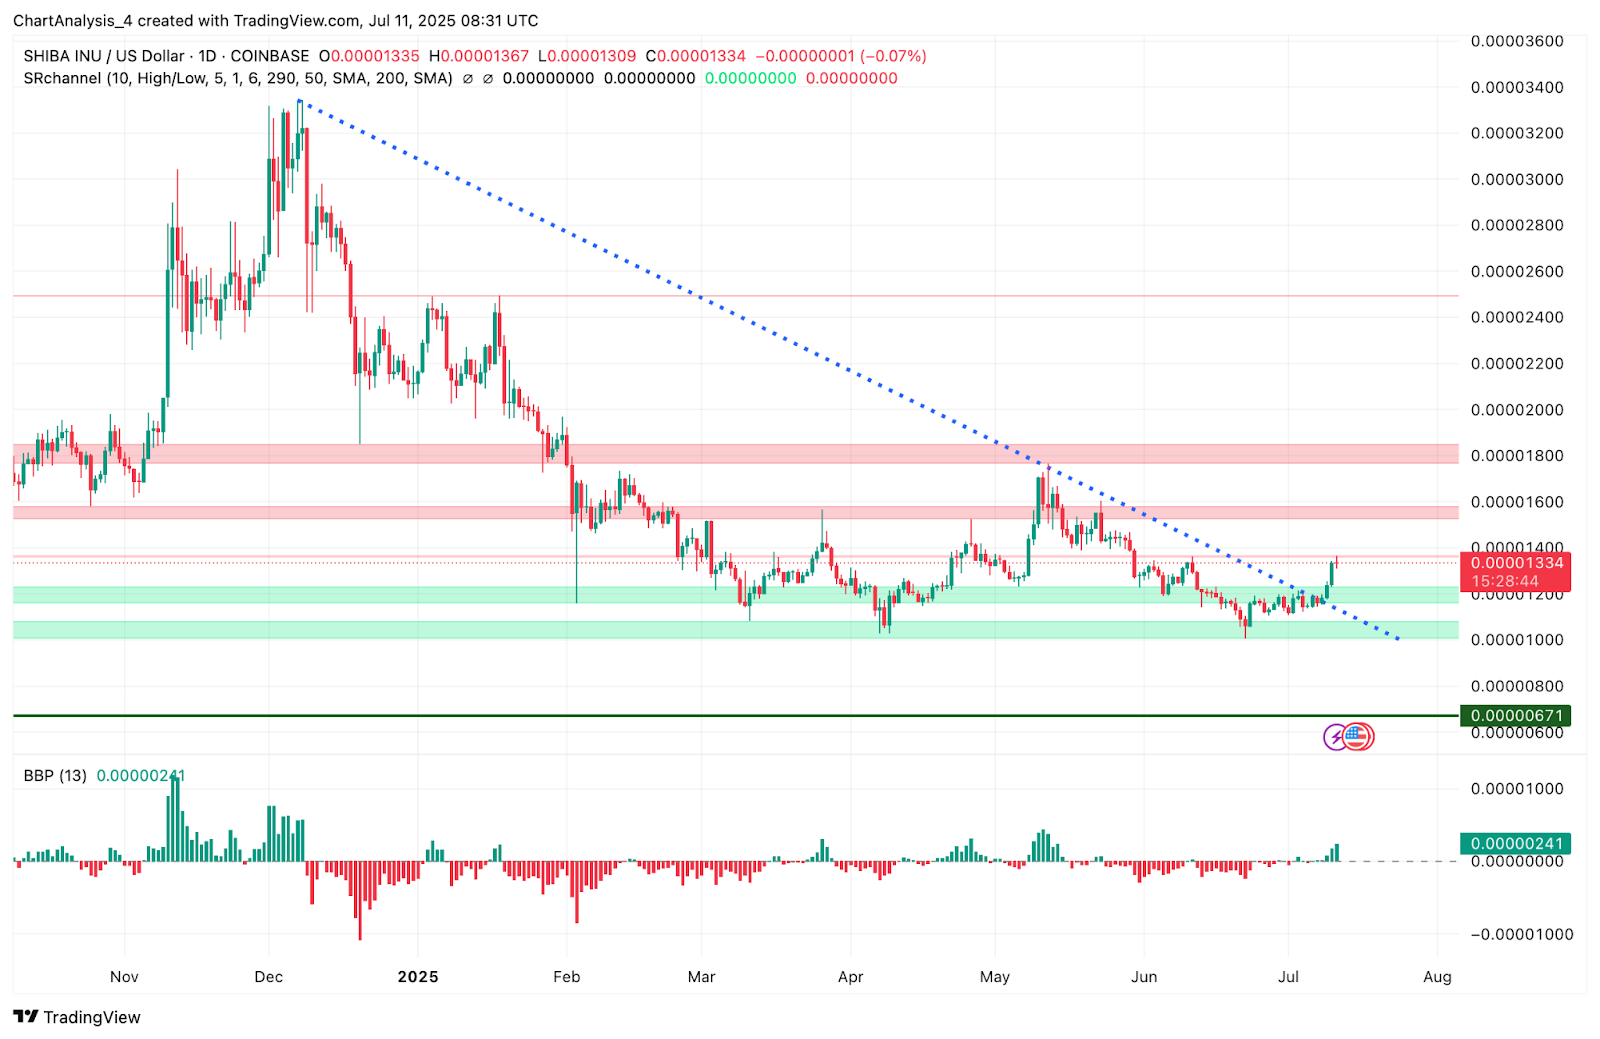
On the daily chart, SHIB has finally cleared a key descending trendline that stretched from the February 2025 swing high. This breakout follows sustained accumulation near the $0.00001100–$0.00001200 support cluster. The move has flipped previous resistance into support and triggered renewed bullish structure.
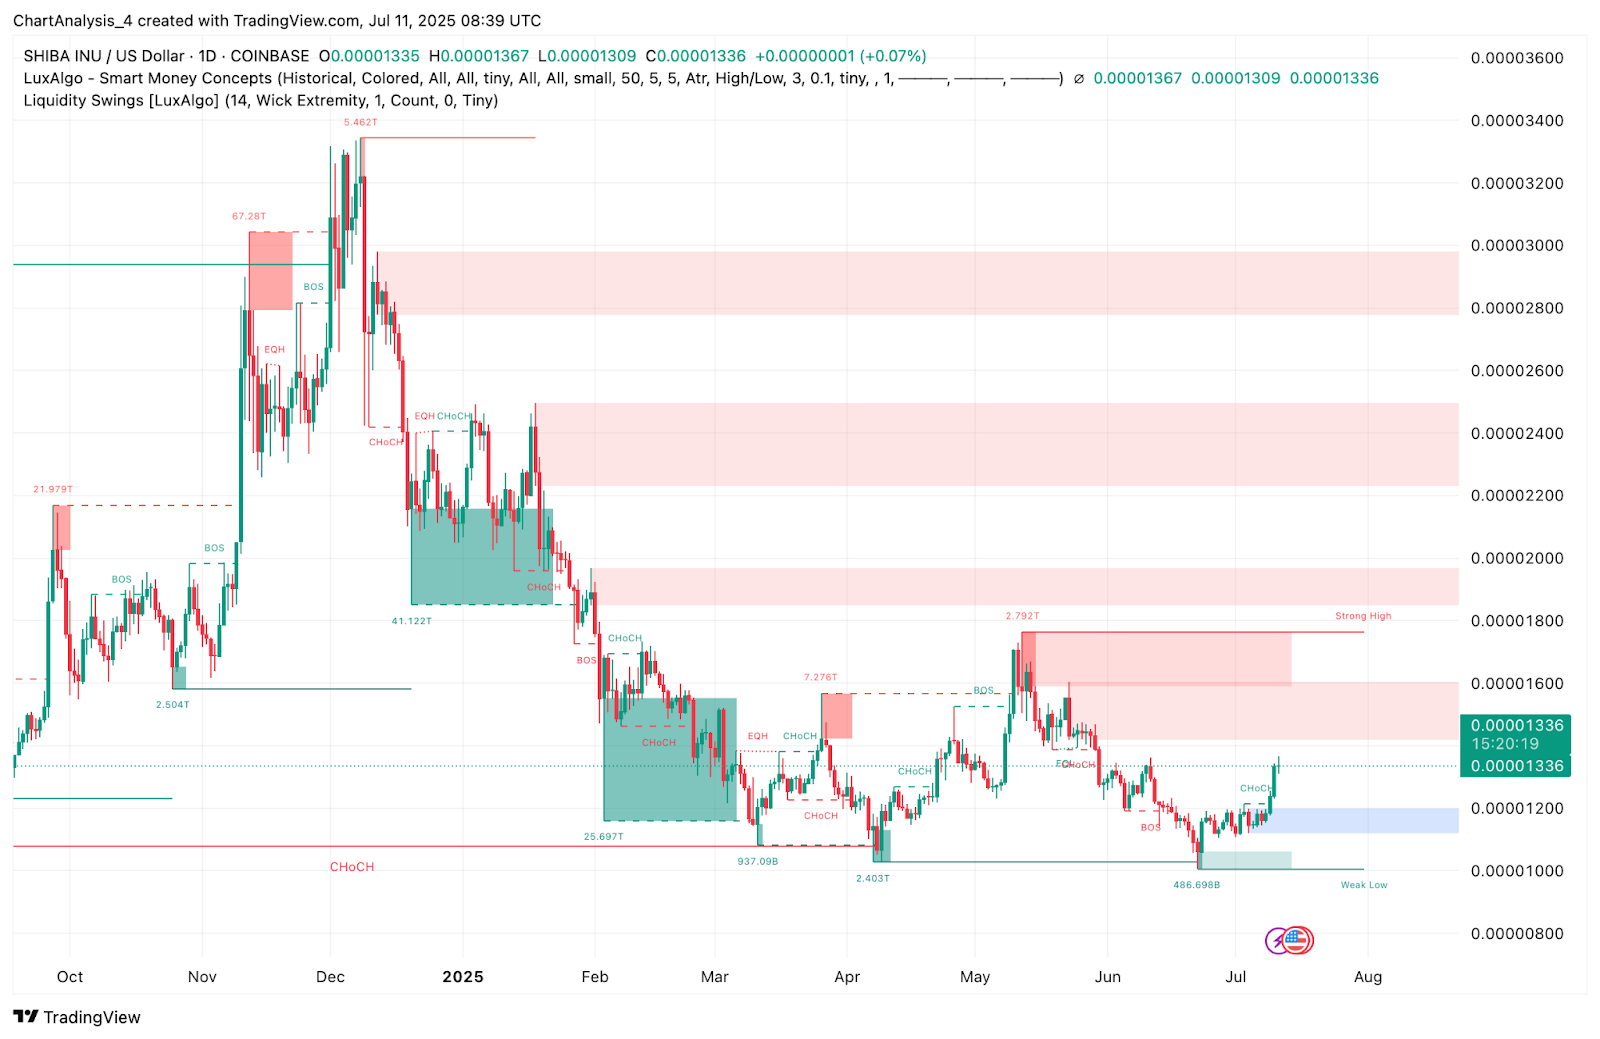
Smart Money Concepts indicators confirm this shift. A bullish CHoCH has formed above $0.00001240, while the BOS near $0.00001290 confirms upward intent. SHIB has now entered a low-liquidity zone that extends toward the $0.00001480 supply block. This area marks the next significant barrier before bulls can target the $0.00001600 zone.
The breakout is also supported by increased volatility. The BBP indicator has turned positive for the first time in over two weeks, aligning with improved price structure.
Why Shiba Inu Price Going Up Today?
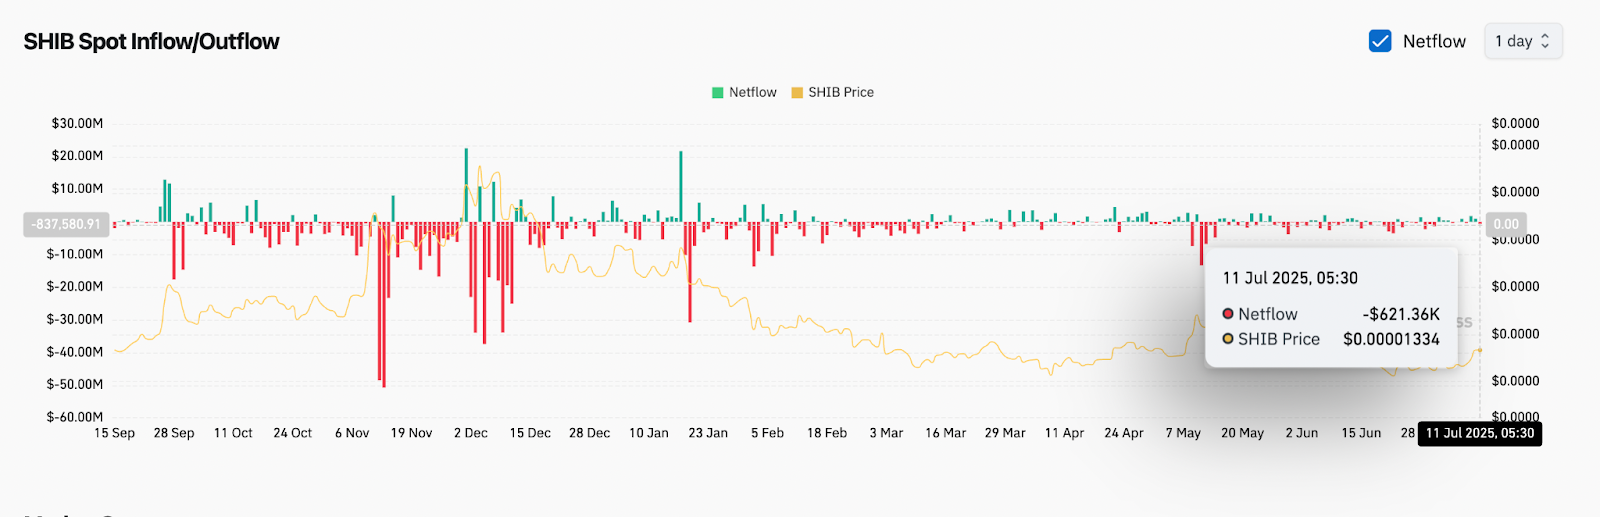
The reason behind the recent price strength lies in a combination of technical breakouts and on-chain confirmation. According to data from SHIB Spot Inflow/Outflow, netflows on July 11 remained negative, with over $621K in outflows. This behavior suggests investors are moving SHIB off exchanges, reducing sell-side pressure and reinforcing bullish sentiment.
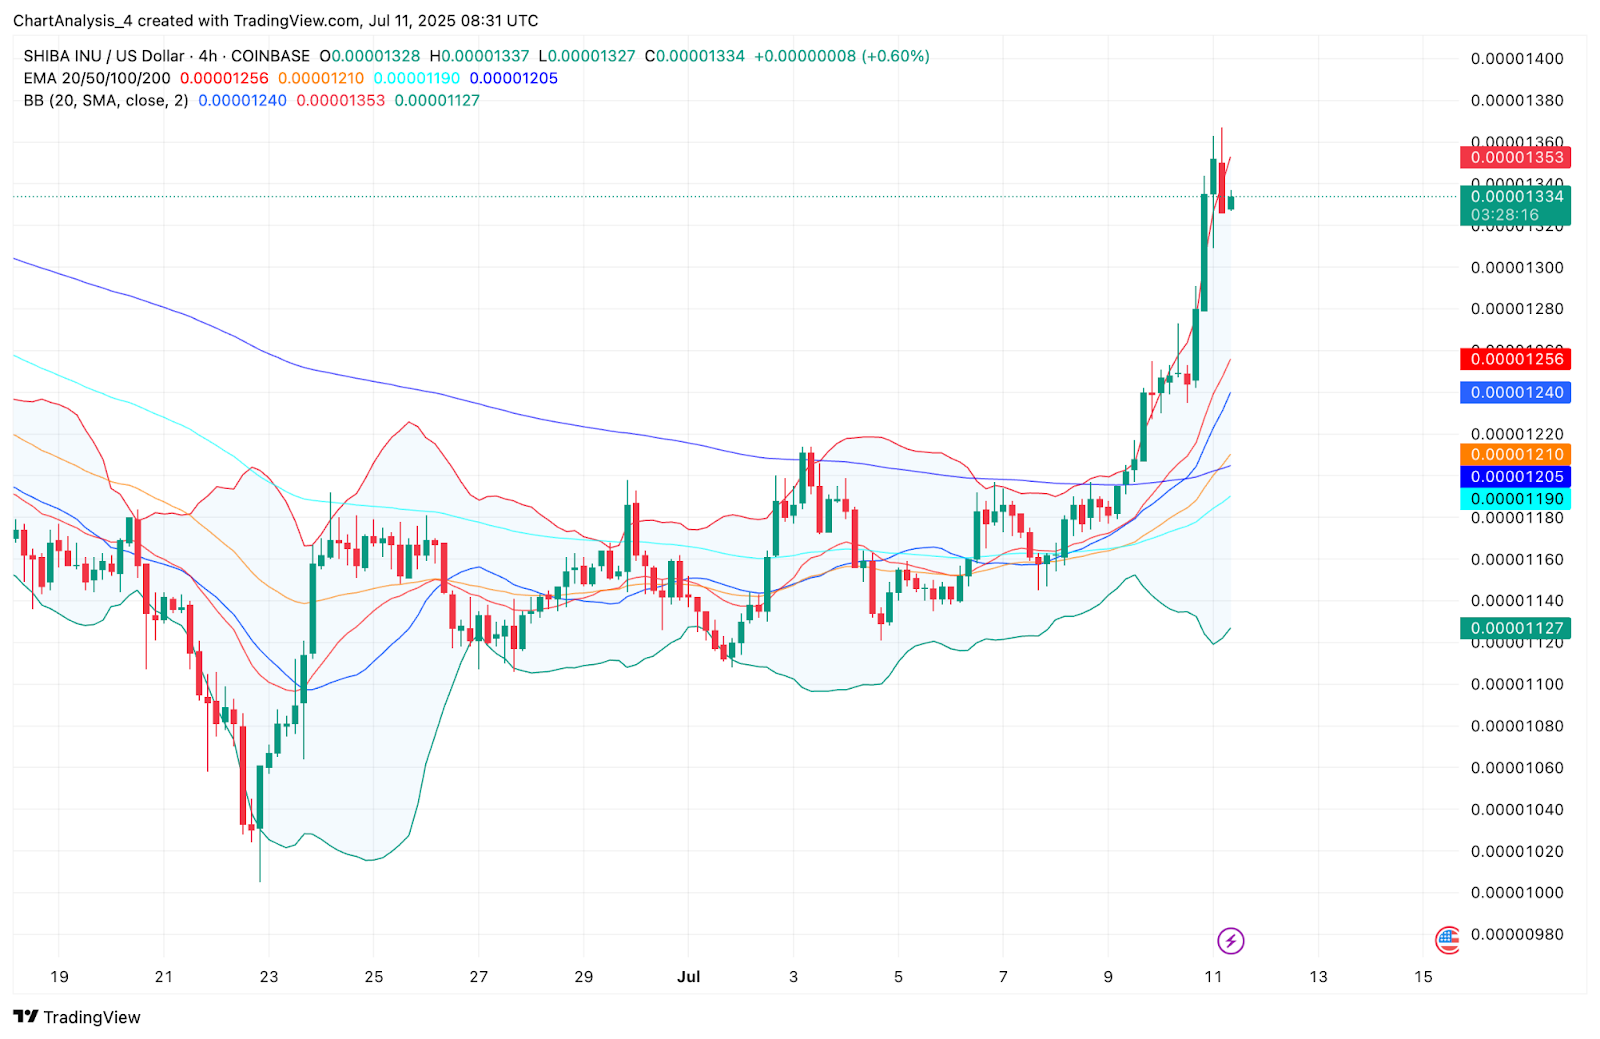
From a short-term technical perspective, the 4-hour chart shows SHIB trading above all major EMAs. The 20/50/100/200 EMA cluster has turned bullish, with the 200 EMA now trailing well below at $0.00001205. Bollinger Bands have expanded following a volatility squeeze, with price hugging the upper band, an indication of strong directional momentum.
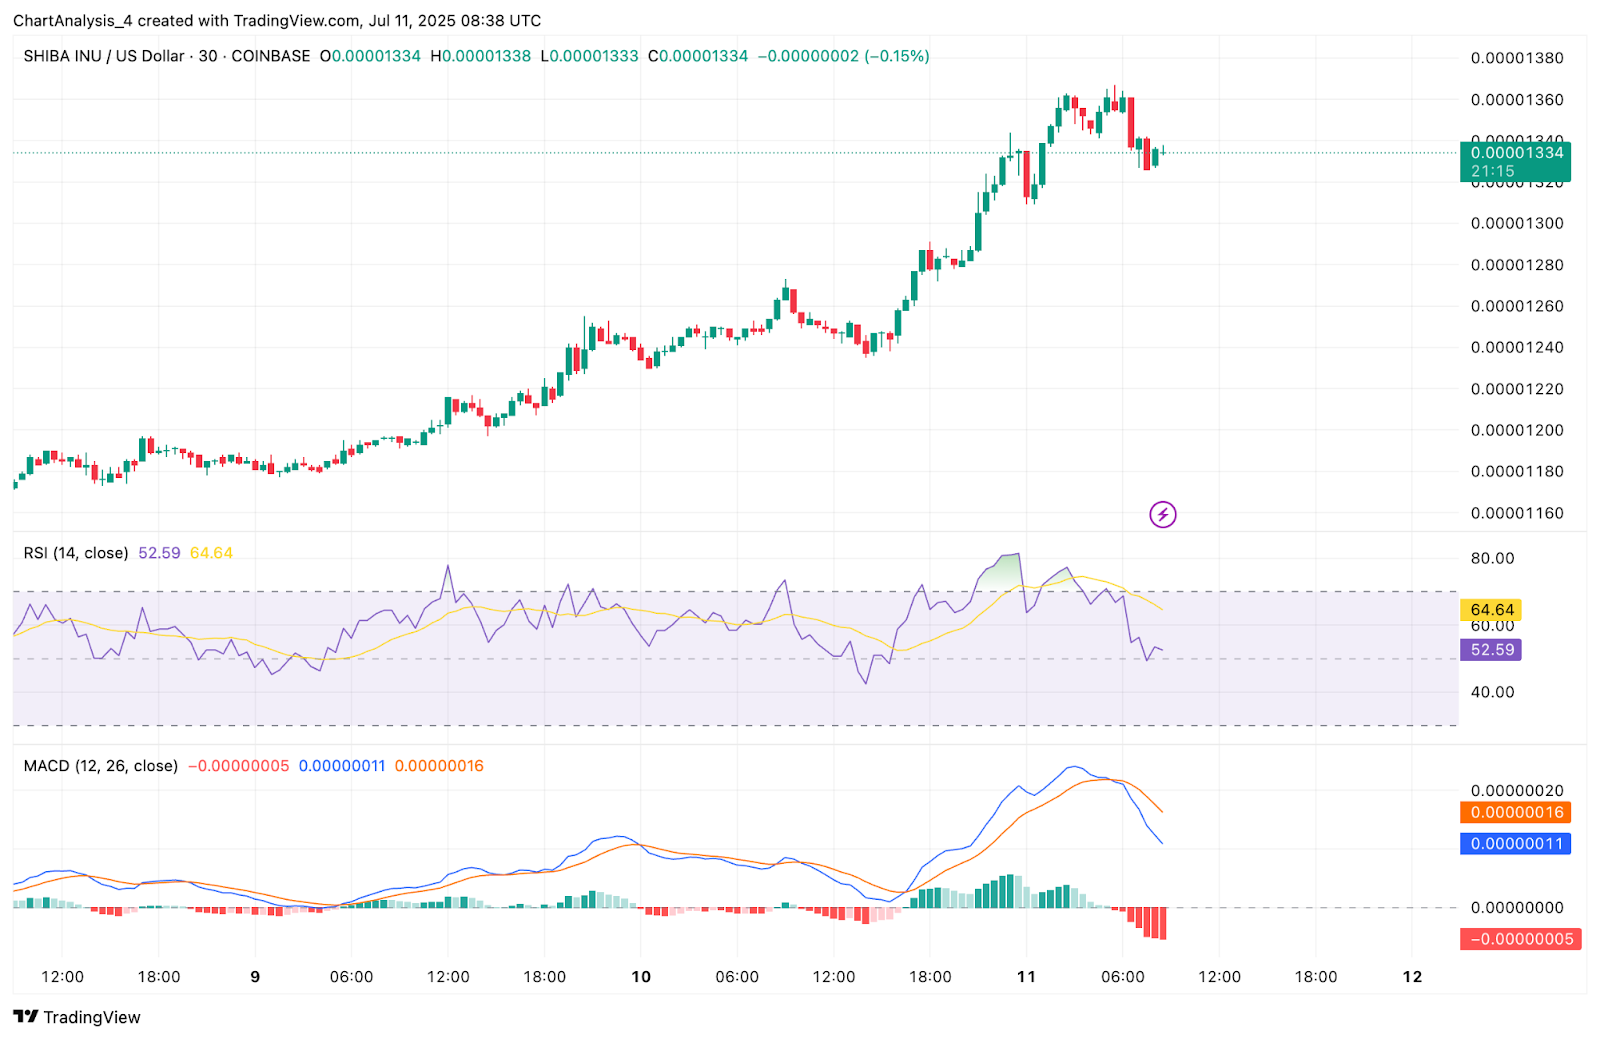
On the 30-minute chart, SHIB has pulled back slightly from its local high of $0.00001367. RSI has cooled to 52.59 after peaking above 64.6, reflecting short-term profit-taking. MACD shows a flattening histogram but has not flipped bearish, suggesting consolidation rather than reversal.
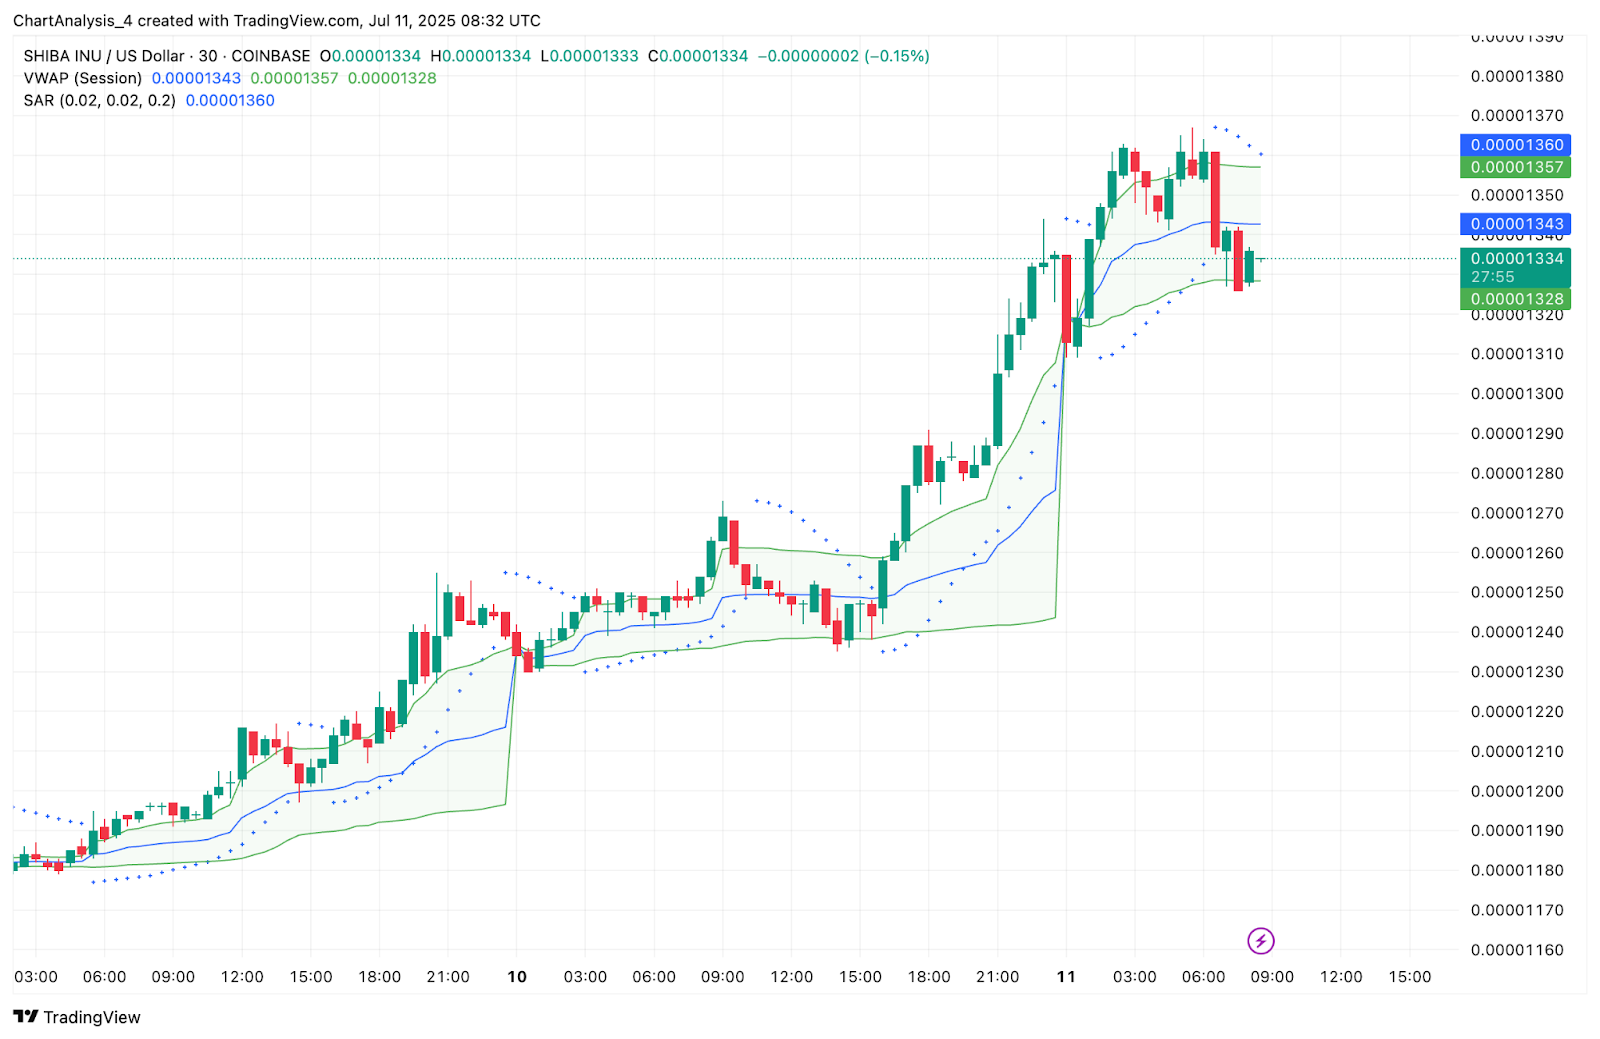
The VWAP line is acting as intraday support near $0.00001328. If SHIB continues to hold above this level, further upside toward $0.00001380 remains probable.
Indicators Suggest Bullish Bias With Room to Run
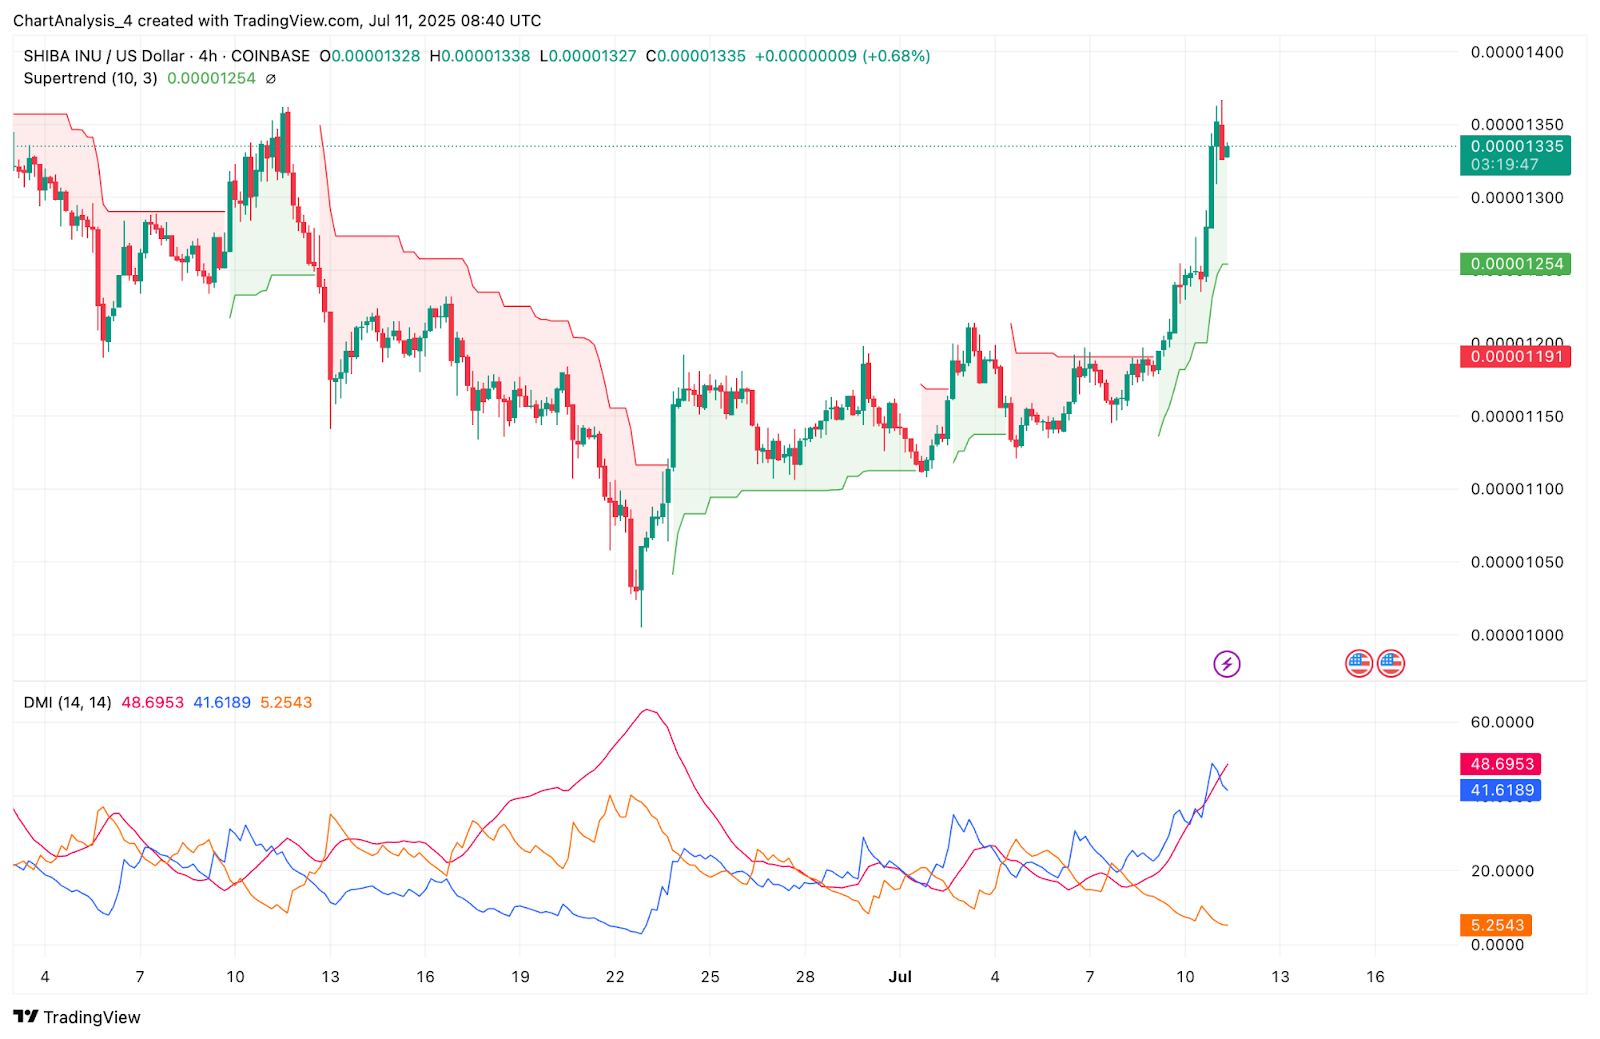
On the 4-hour chart, the Supertrend indicator flipped bullish on July 10 and remains green, with the support base climbing toward $0.00001254. Directional Movement Index (DMI) shows strong trend alignment. The +DI line at 48.6 is leading well above -DI at 41.6, while the ADX is rising, signaling a strong trend structure.
Smart Money liquidity zones indicate SHIB is currently working through a low-resistance area between $0.00001290 and $0.00001480. If bulls maintain control, price could spike rapidly into this vacuum.
On-chain metrics support this possibility. Despite exchange reserve levels holding steady, the outflow activity and declining deposit addresses indicate reduced selling intent among holders.
SHIB Price Prediction: Short Term Outlook (24H)
If Shiba Inu price holds above the $0.00001320–$0.00001328 band, the next leg could test $0.00001380 followed by $0.00001480. Breaking above this zone opens the door toward the March swing high near $0.00001600.
However, a failure to maintain VWAP support could send price back toward the 20 EMA on the 4-hour chart near $0.00001256. This would still be considered a healthy pullback as long as price stays above $0.00001200.
Given the breakout from the trendline, bullish DMI, and supportive on-chain flows, the bias for SHIB remains upward but traders should monitor intraday volume and VWAP stability closely.
Shiba Inu Price Forecast Table: July 12, 2025
| Indicator/Zone | Level / Signal |
| Shiba Inu price today | $0.00001334 |
| Resistance 1 | $0.00001380 |
| Resistance 2 | $0.00001480 |
| Support 1 | $0.00001328 (VWAP support) |
| Support 2 | $0.00001256 (20 EMA 4H) |
| RSI (30-min) | 52.59 (cooled from 64) |
| MACD (30-min) | Bullish, flattening momentum |
| Bollinger Bands (4H) | Expanding, momentum continuation |
| Supertrend (4H) | Bullish above $0.00001254 |
| DMI (14) | +DI leading, ADX rising |
| Smart Money CHoCH / BOS | Bullish above $0.00001290 |
| Spot Netflow | -$621K (bullish outflow behavior) |
Disclaimer: The information presented in this article is for informational and educational purposes only. The article does not constitute financial advice or advice of any kind. Coin Edition is not responsible for any losses incurred as a result of the utilization of content, products, or services mentioned. Readers are advised to exercise caution before taking any action related to the company.


