 Price Prediction for July 27")
Shiba Inu is trading around $0.00001403 as of press time while the intraday price action coils within a symmetrical triangle on the 1-hour chart. After rebounding from the $0.00001337 support cluster, bulls are attempting to reclaim lost ground, but overhead pressure from the Supertrend band and key EMAs is capping upside momentum. Price structure suggests that a volatility expansion is imminent.
What’s Happening With Shiba Inu’s Price?
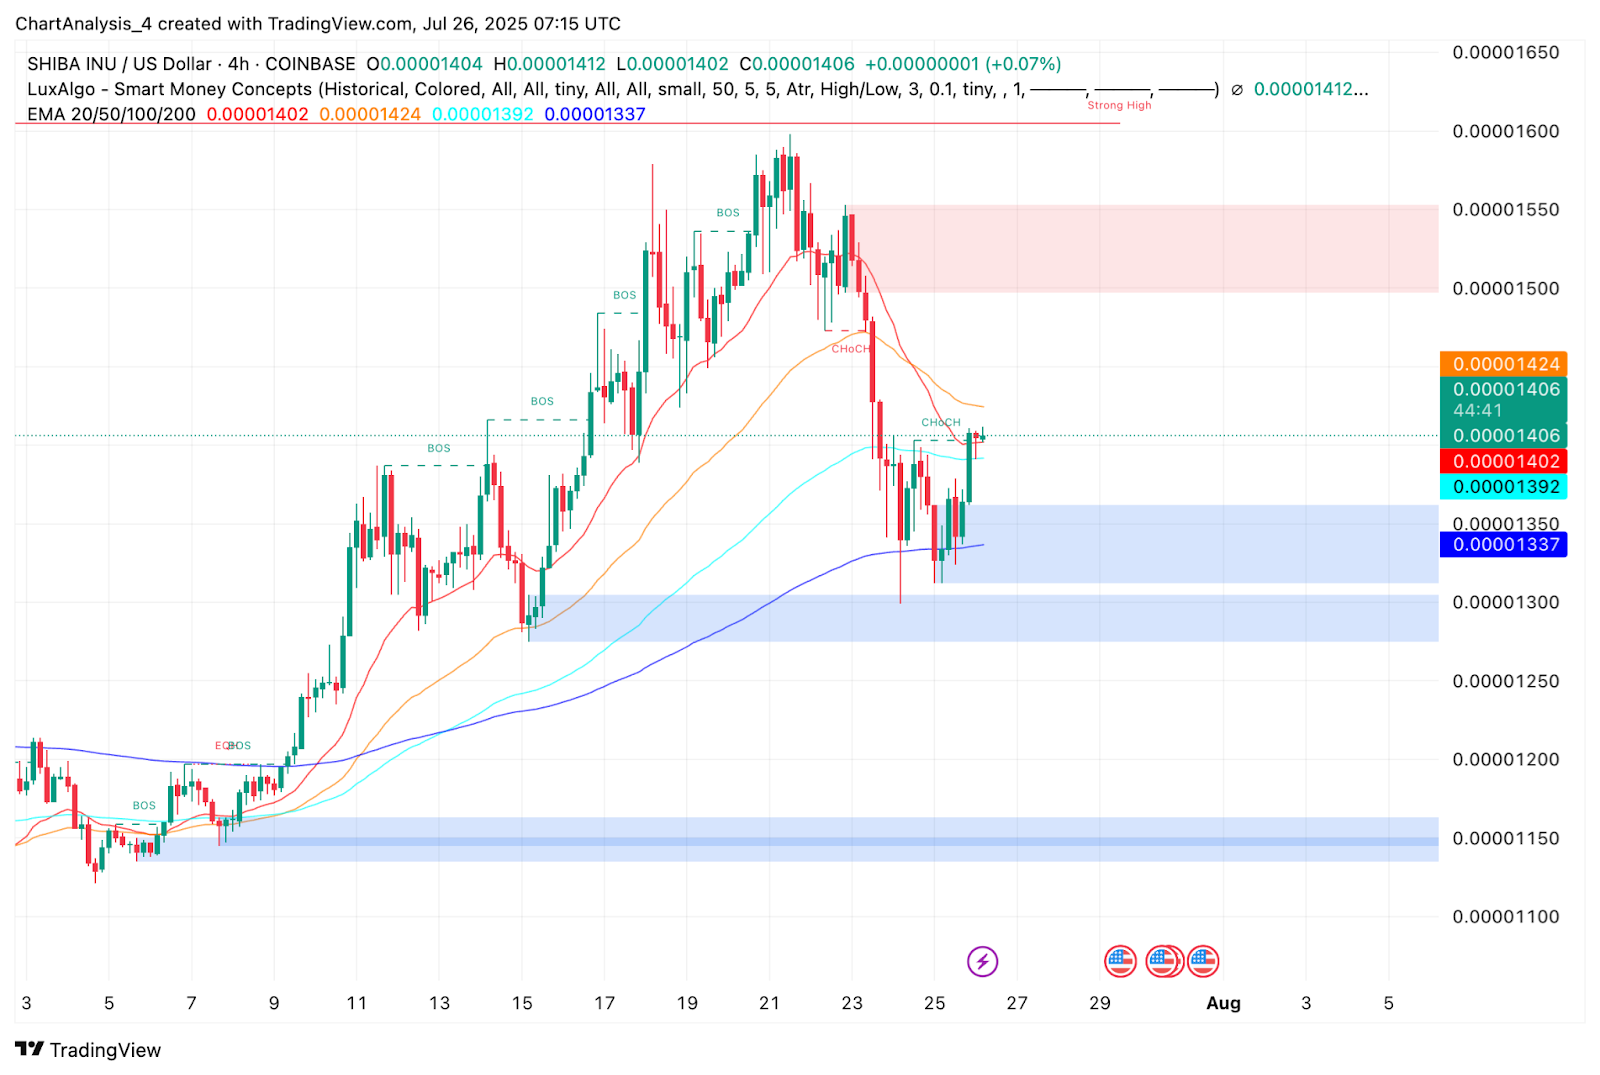
SHIB has formed a short-term base above the $0.00001335–$0.00001350 demand zone, supported by multiple CHoCH formations and a bullish candle structure on the 4-hour chart. The recent reclaim of the 100 and 200 EMA zones ($0.00001392 and $0.00001337) is encouraging for bulls, but the 20/50 EMA ribbon remains flat just above current levels, with resistance near $0.00001424.
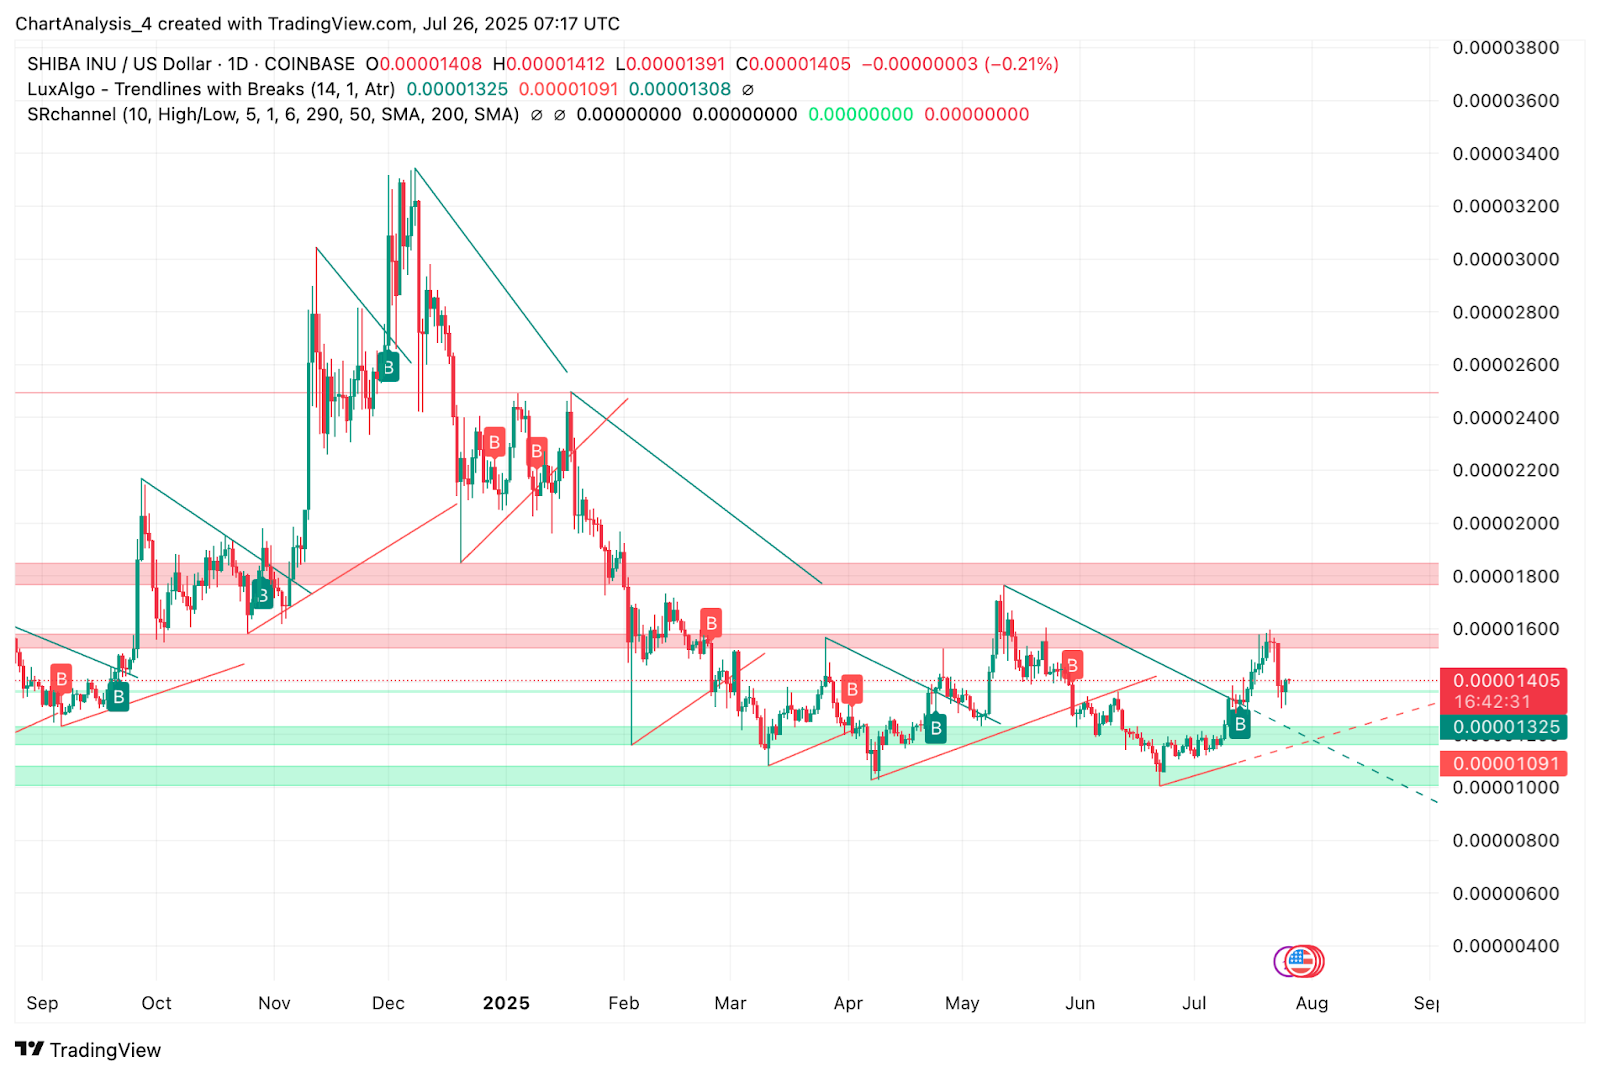
On the daily timeframe, SHIB remains wedged inside a broad descending channel. The asset failed to sustain above the $0.00001550 resistance last week and sharply reversed near the upper boundary of the red supply zone. Currently, SHIB is consolidating above a key trendline that originates from May lows, suggesting the structure is still constructive unless $0.00001300 is breached on a closing basis.
Why Is the SHIB Price Down Today?
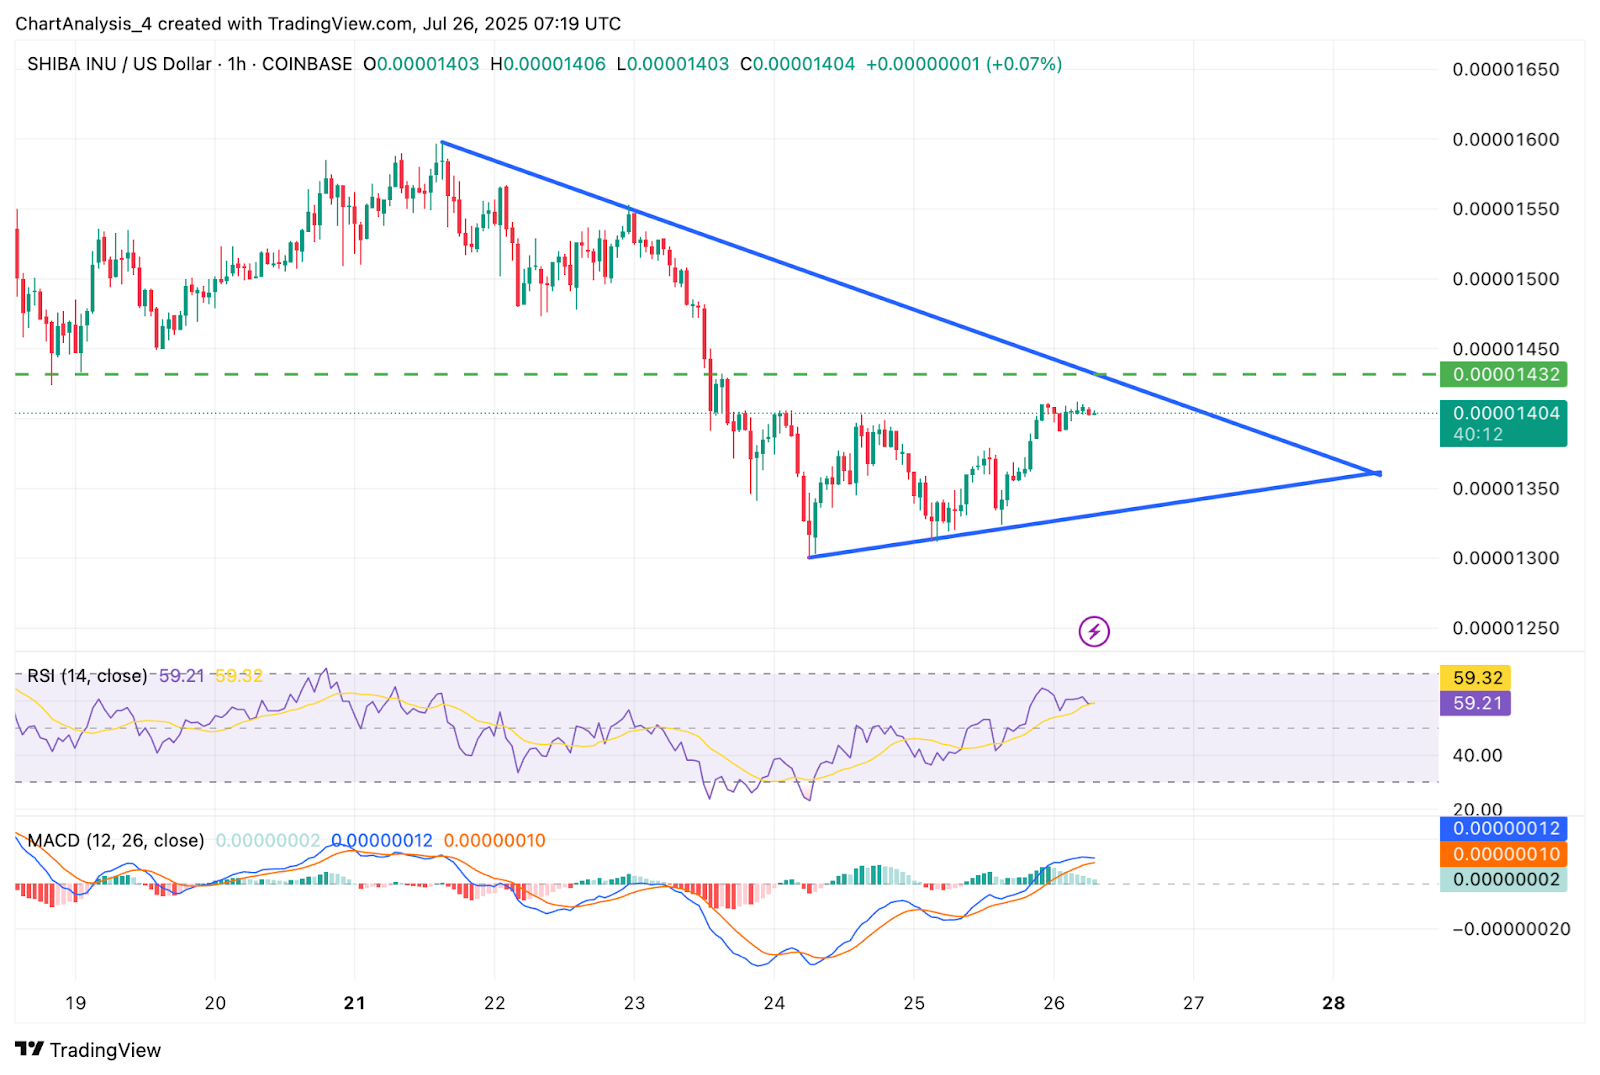
The recent downward pressure is largely due to short-term rejections at key technical levels such as structural resistance and indicator alignment. On the 1-hour chart, SHIB is struggling to break above a descending trendline that has acted as dynamic resistance since July 22. The triangle structure is compressing toward its apex, with horizontal resistance at $0.00001432 acting as the ceiling.
Momentum indicators show early signs of fatigue. The RSI sits near 59.2 below the bullish 60 threshold, while MACD remains in positive territory but is beginning to flatten, suggesting a potential stall in momentum. On the 4-hour Supertrend chart, price remains under the bearish flip zone at $0.00001479, confirming that bulls still lack confirmation for a trend reversal.
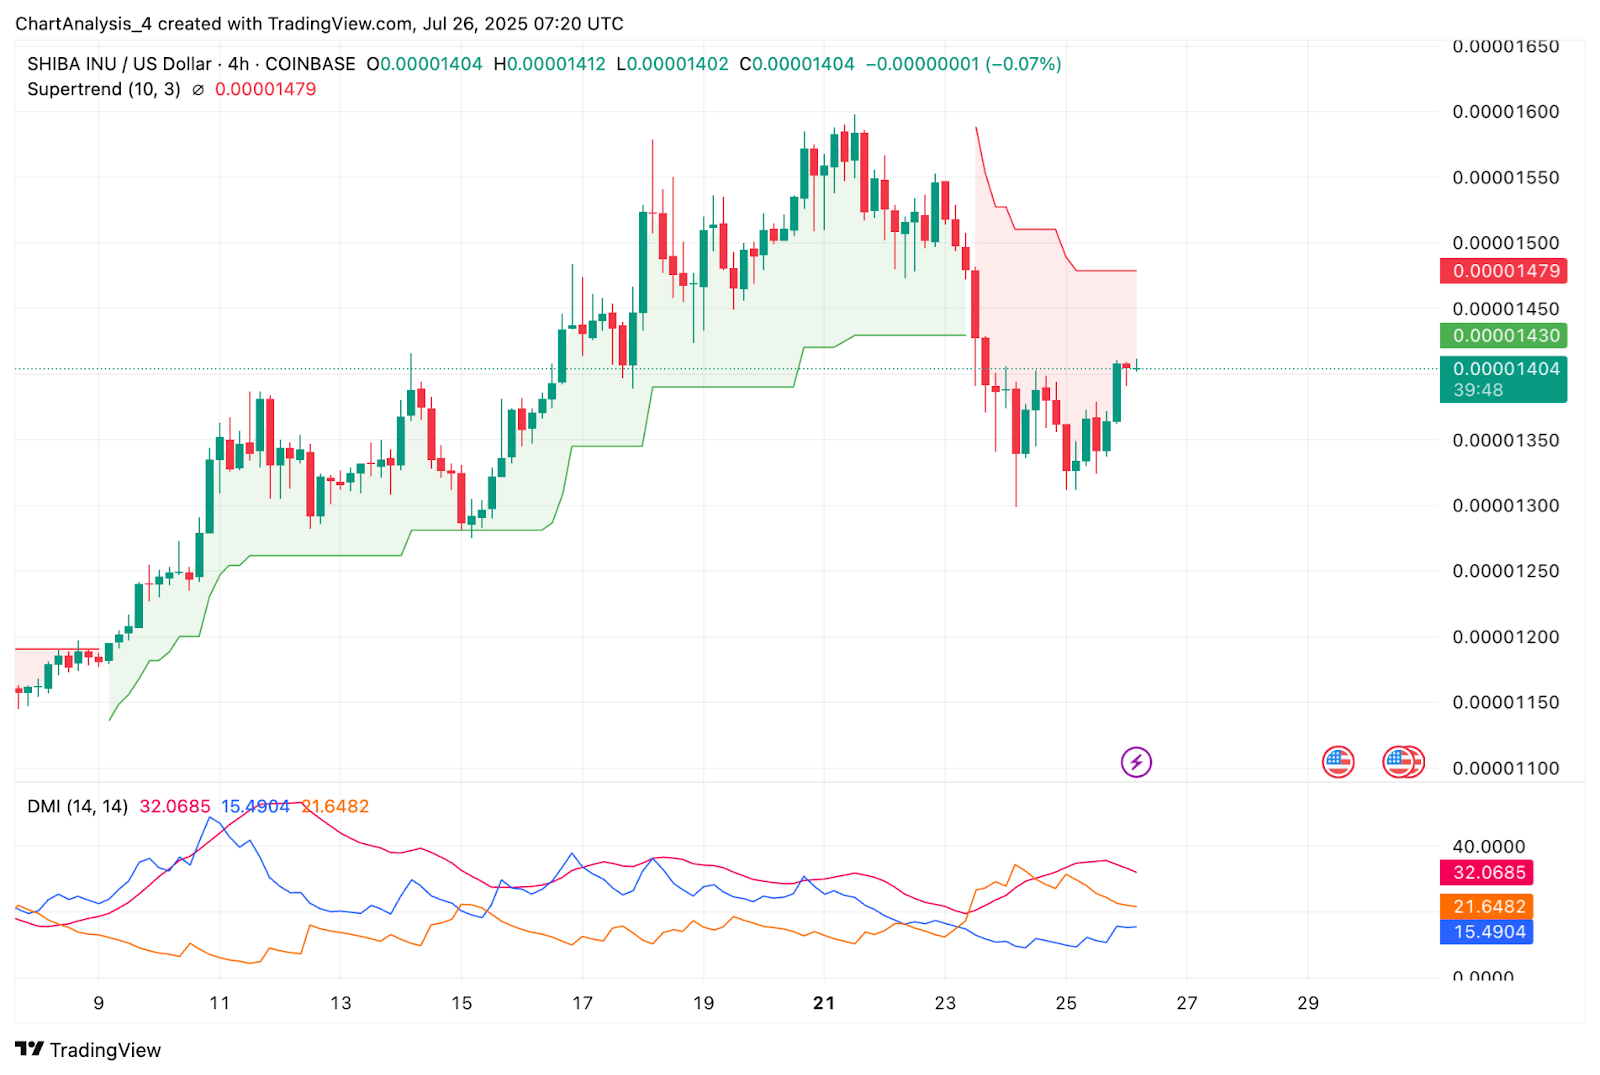
Adding to the caution, directional movement indicators show mixed signals. While the ADX is rising to 32.0, the +DI line has yet to assert clear leadership over the -DI, suggesting trend strength without bullish dominance.
SHIB Price Indicators Signal Compression and Reversal Risk
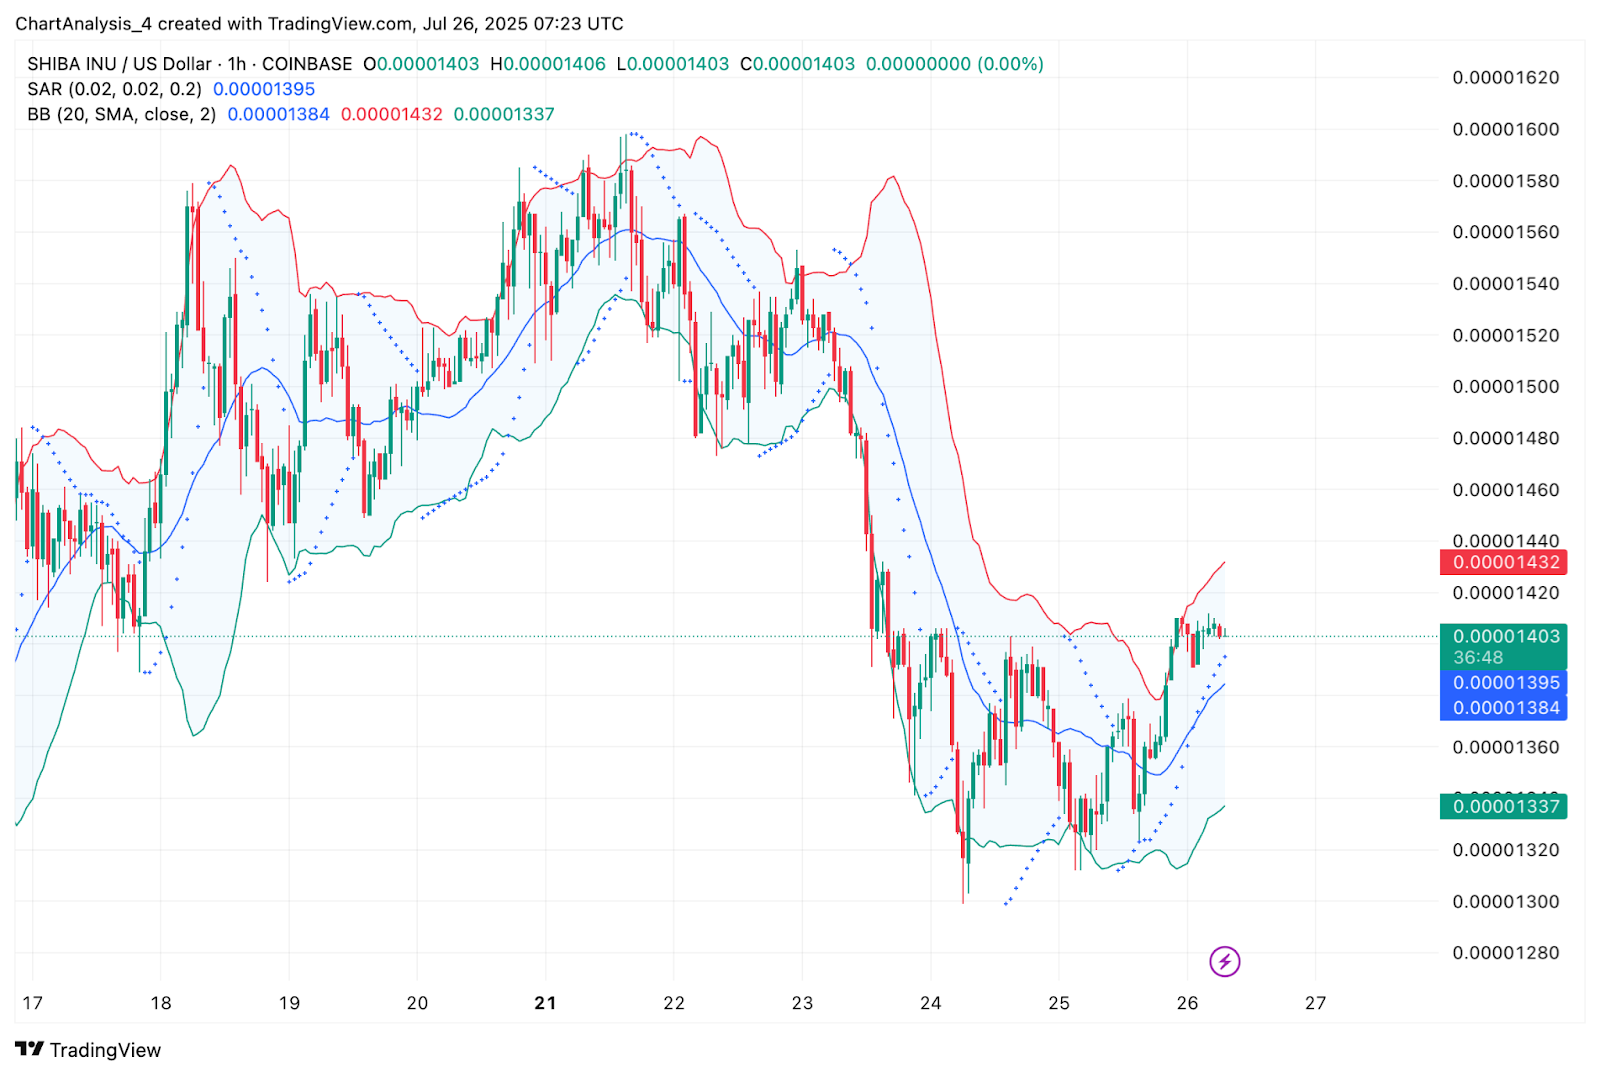
On the lower timeframes, Bollinger Bands are starting to expand on the 1-hour chart after a recent squeeze, with price testing the midline near $0.00001403. This area aligns with the Parabolic SAR dot at $0.00001395 which is a critical inflection point. A close above this region could open the door for another push toward $0.00001432 and higher, while failure to reclaim may reintroduce downward volatility.
Smart Money Concepts (CHoCH/BOS) continue to highlight short-term bullish shifts but the overall market remains indecisive. Daily trendlines from the larger wedge and supply rejection zones near $0.00001550 continue to weigh on bullish continuation.
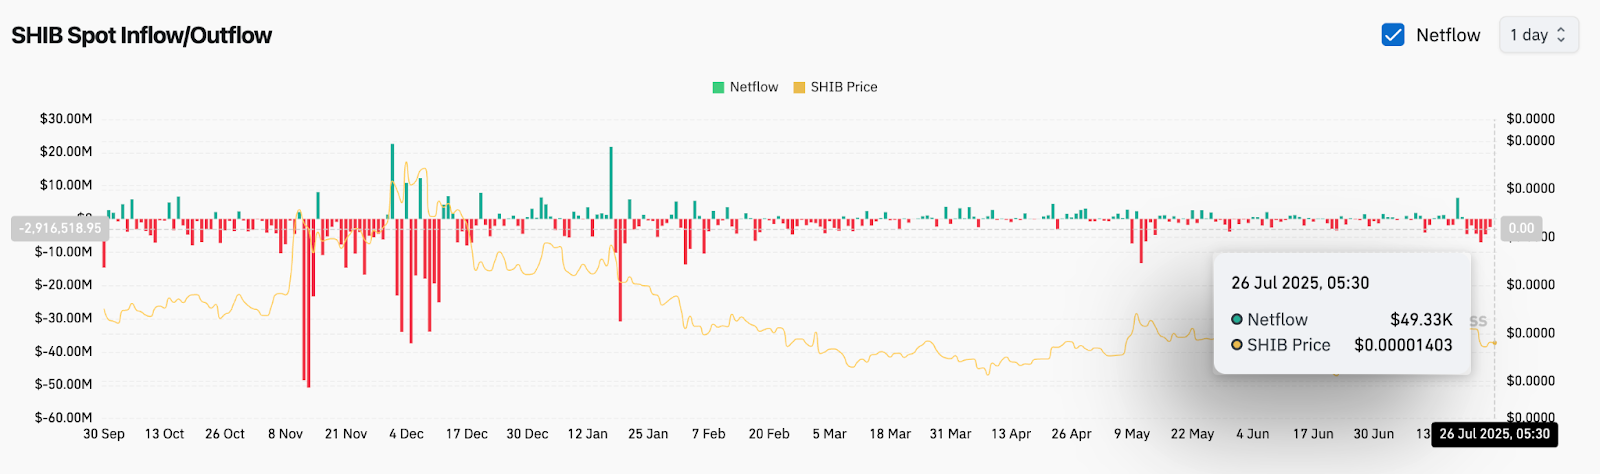
Lastly, derivatives data shows that SHIB recorded a modest $49.3K net inflow over the last 24 hours, indicating weak but present buyer activity. However, broader netflows remain relatively muted, reflecting cautious market sentiment amid compressed volatility.
SHIB Price Prediction: Short-Term Outlook (24H)
If bulls manage to flip the $0.00001432 barrier with volume confirmation, the next upside targets lie near $0.00001479 (Supertrend flip) and $0.00001520. Beyond that, the broader reversal zone remains the $0.00001550–$0.00001600 range.
On the downside, a rejection from $0.00001432 and a breakdown below the triangle support at $0.00001350 could send SHIB back toward $0.00001300 and even $0.00001260. Momentum indicators are neutral, so price reaction near triangle edges will define the immediate trend.
With RSI below 60, MACD flattening, and Supertrend resistance still in play, Shiba Inu price needs a decisive breakout to establish direction. Until then, expect tight-range trading with breakout risk skewed to the upside.
Shiba Inu Price Forecast Table: July 27, 2025
| Indicator/Zone | Level / Signal |
| Shiba Inu price today | $0.00001403 |
| Resistance 1 | $0.00001432 (horizontal + BB upper) |
| Resistance 2 | $0.00001479 (Supertrend flip) |
| Support 1 | $0.00001350 (triangle base) |
| Support 2 | $0.00001300 (major support) |
| RSI (1H) | 59.2 (Neutral-Bullish) |
| MACD (1H) | Flattening, bullish cross holding |
| Bollinger Bands (1H) | Expanding after squeeze |
| Supertrend (4H) | Bearish below $0.00001479 |
| DMI (14) | ADX 32.0, mixed directional bias |
| Parabolic SAR | Bullish above $0.00001395 |
| Netflow (24h) | +$49.3K (mild spot inflow) |
Disclaimer: The information presented in this article is for informational and educational purposes only. The article does not constitute financial advice or advice of any kind. Coin Edition is not responsible for any losses incurred as a result of the utilization of content, products, or services mentioned. Readers are advised to exercise caution before taking any action related to the company.


