
 Hits 7-Day High on Merger Announcement, Indicator Foresee Bull Rally")

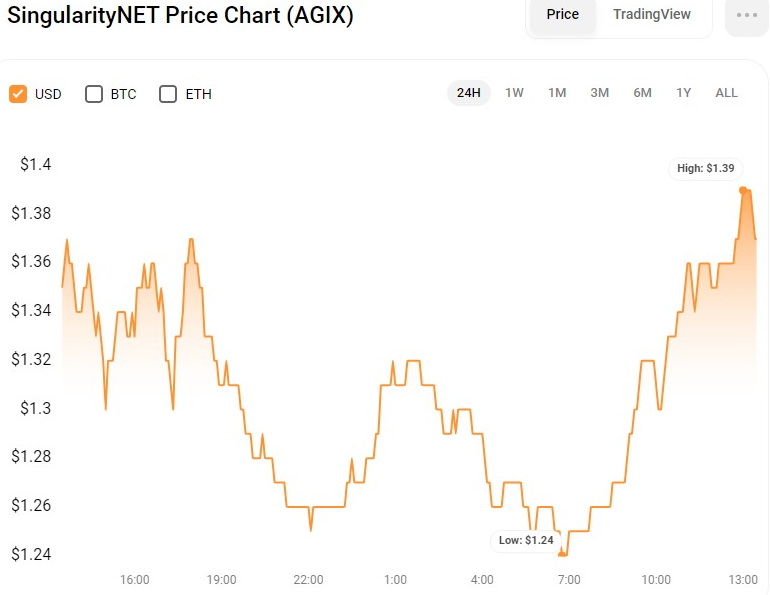
- AGIX’s price hits a 7-day high at $1.39, up 28% over the month amid merger news.
- AGIX volume surges by 97.27%, and the market cap reaches $1.78 billion.
- Bollinger bands widen on the AGIX chart, signaling increased volatility.
Since the news of a merger of SingularityNET (AGIX), Fetch.ai (FET), and Ocean Protocol (OCEAN) into AltSignals (ASI) Token, which would have a diluted valuation of $7.5 billion, AGIX has been on a positive surge. As a result, the AGIX bullish momentum regained strength, sending the price to a 7-day high of $1.39 after finding support at an intra-day low of $1.20. At press time, AGIX was trading at $1.39, up 7.98% in the prior 24 hours and 28% in the previous month.
If the positive momentum breaks over the $1.39 resistance, the next resistance levels to watch for are $1.50 and $1.60, as investors continue to believe in the potential of AltSignals (ASI) Token. However, if the price fails to break over $1.39, there may be a brief pullback down to the $1.20 support level before trying another positive rise.
During the rise, AGIX’s market capitalization and 24-hour trading volume increased by 7.595% and 97.27%, respectively, to $1,775,791,076 and $544,730,216. This jump reflects increased interest and investment in the AGIX token, with the potential for more gains if the bullish trend continues.
AGIX/USD Technical Analysis
On the AGIXUSD 4-hour price chart, the Bollinger bands are widening, with the upper and lower bands touching $1.3686 and $1.07931, respectively. This trend points to heightened volatility in the near future, with the upper and lower bands possibly serving as resistance and support levels for price moves.
However, as the bullishly engulfed candlestick has breached the upper Bollinger band, the upward trend may continue in the short term. Conversely, this might suggest an overbought position, which could result in a price downturn.
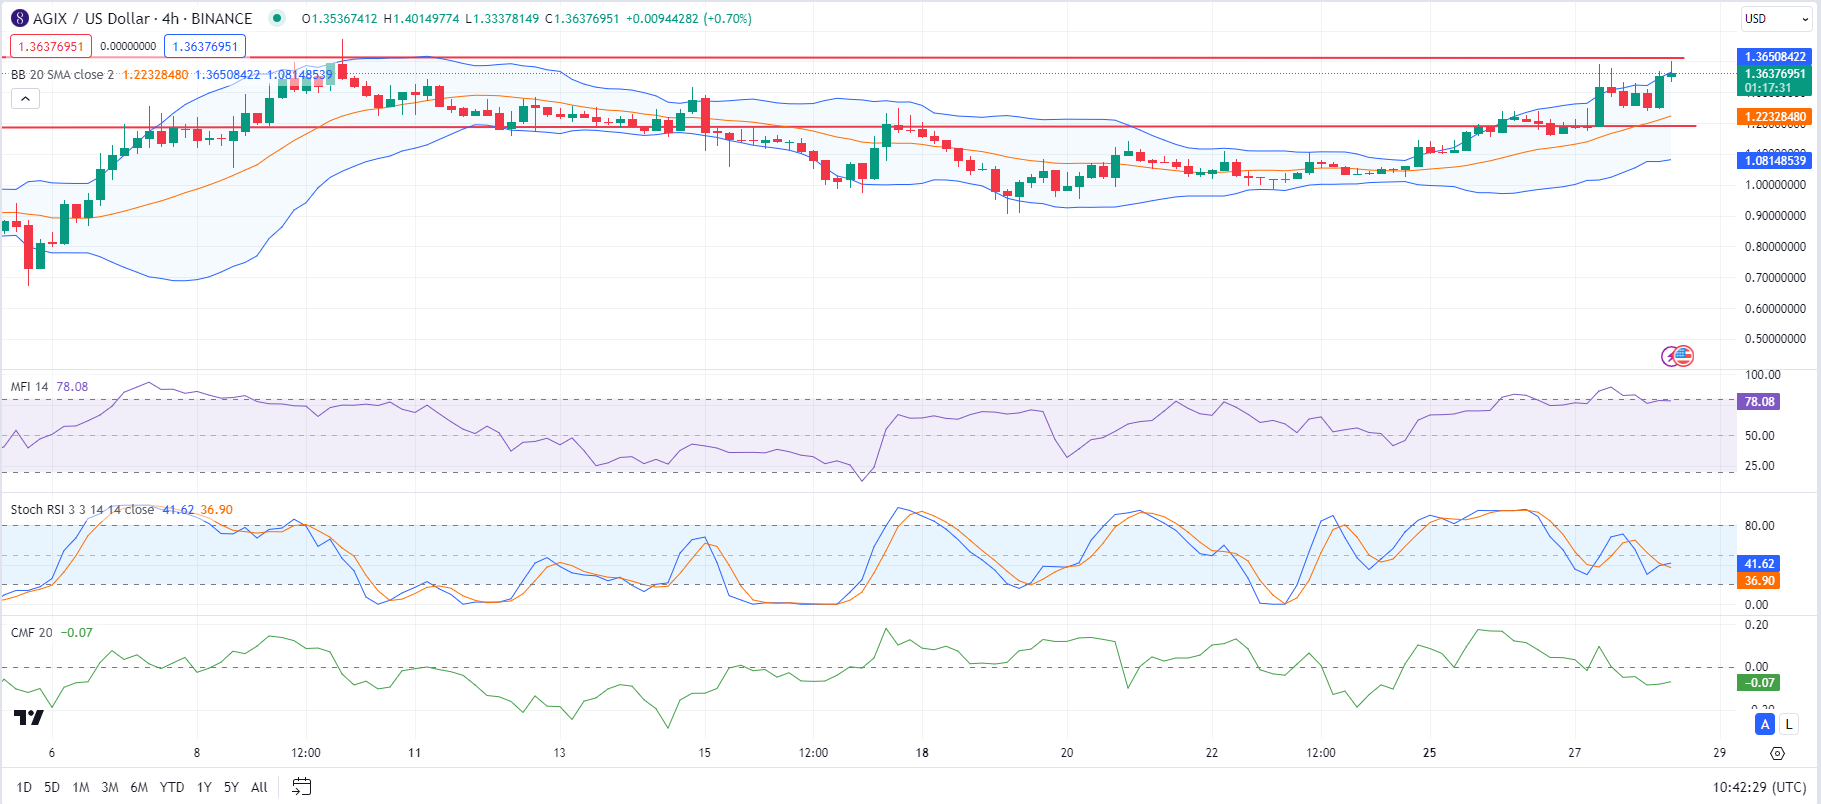
The Money Flow Index (MFI) rating of 78 lends validity to the overbought circumstances, indicating that the asset’s present upward momentum may be reaching its limit. As a result, traders should take care and constantly monitor market movement for indications of a reversal or correction. However, with the stochastic RSI moving above its signal line at 42.89, there is still room for more upward movement before a correction happens.
Furthermore, the Chaikin Money Flow (CMF), which is now in the negative area with a rating of -0.06, is rising, indicating that selling pressure may be diminishing and purchasers may soon reclaim control of the asset’s price movement. This suggests that, while prudence is advised, there is potential for more positive momentum soon.
Disclaimer: The information presented in this article is for informational and educational purposes only. The article does not constitute financial advice or advice of any kind. Coin Edition is not responsible for any losses incurred as a result of the utilization of content, products, or services mentioned. Readers are advised to exercise caution before taking any action related to the company.


 and Litecoin (LTC) Ready for a Bullish Breakout Near Key Resistance Level: Can CYBRO Outshine Them?")


 sees a surge to $1.39 amid merger news, signaling strong bullish momentum and potential for further gains.)