")
- Binance has started purchasing Solana amid the recent dip in the price of the SOL token.
- SOL dropped to a 3-month low of $160 after soaring to a new all-time high in January.
- Spot ETF applications from Grayscale, VanEck, and more await for SEC approval.
Solana (SOL) is experiencing a sharp pullback from its January peak of $293 to a recent 3-month low of around $160. However, the cryptocurrency could be turning things around as leading crypto exchange Binance has once again started purchasing the altcoin in massive quantities.
Crypto analyst MartyParty pointed out a significant development in Binance’s SOL holdings in a post on X (formerly Twitter). The exchange strategically sold its SOL reserves near the January peak and has now started accumulating again at the lower price levels.
This move suggests that institutional players and large market participants are buying the dip, which could provide strong support for a potential price rebound.
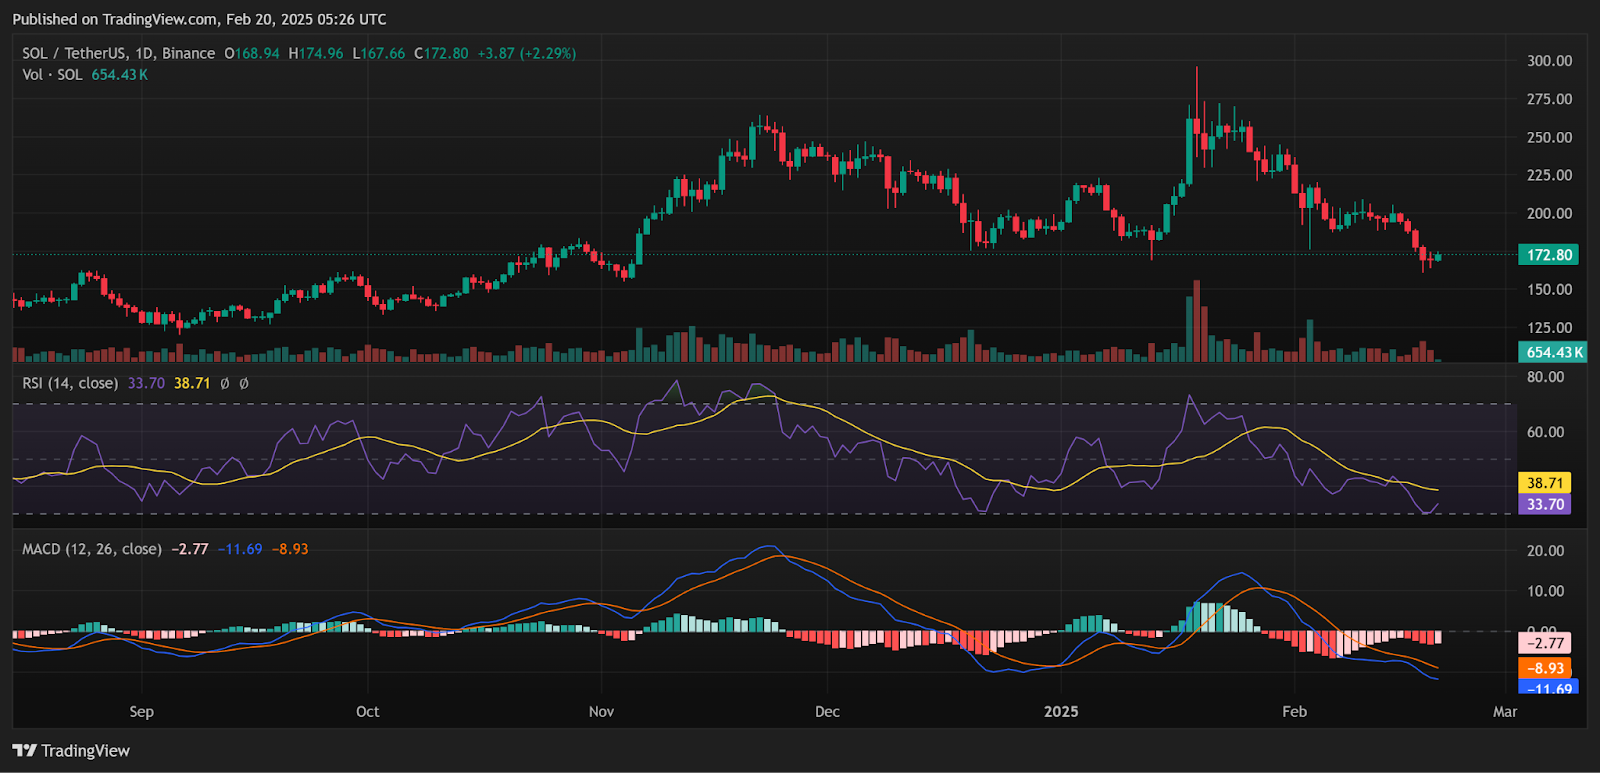
At the time of writing, SOL was trading at $172.86, up 5% in the past 24 hours. The price remains near a key support level of $160, which has so far prevented further drops.
The cryptocurrency lost the 20-day exponential moving average (EMA) at $193.48 after forming five straight bearish daily candles. The 20-day EMA now presents a major resistance level for the bulls.
Related: Solana Price Prediction: Can SOL Rally or Dip Coming on February 20th?
Solana ETF on the Horizon
Meanwhile, the chances of approval of a spot Solana exchange-traded fund (ETF) in the United States could push the SOL token higher as the market cycle progresses.
Firms like Grayscale, 21Shares, Bitwise, and VanEck have submitted applications for a Solana-focused investment product.
SOL Price Analysis
The Solana Relative Strength Index (RSI) reads a value of 33.70, which is just above the oversold threshold of 30. This suggests that the selling spree might be losing steam, and a bounce could be on the horizon if buying volume picks up. Simply put, the RSI helps traders see if an asset is being oversold, and a reading close to 30 often hints at a potential price increase.
Related: Solana’s Crown Slipping? Cardano Heats Up as a Top Crypto Rival
On the other hand, the MACD indicator shows that the MACD line (blue) is below the signal line (orange) and the MACD histogram is also red. The bears are still in control, but the slightly decreasing selling momentum indicates that the downtrend could be weakening. Basically, the MACD helps gauge momentum and right now, it suggests sellers are still in charge, but they might be losing their grip.
Disclaimer: The information presented in this article is for informational and educational purposes only. The article does not constitute financial advice or advice of any kind. Coin Edition is not responsible for any losses incurred as a result of the utilization of content, products, or services mentioned. Readers are advised to exercise caution before taking any action related to the company.


 Price Prediction: Weak Momentum Signals Possible Drop to $62K")