
- SOL trades at $83.40, up 1.12%, with the Supertrend at $79.67 as the last support before the February low at $67.44.
- US SOL spot ETFs recorded $6.17M in outflows on March 30, pushing cumulative inflows back to $979.37M as total net assets fell to $801.91M.
- The biweekly chart places SOL at the 0.618 Fibonacci level at $52.11 to $72.55, the same zone that preceded the rally to $295 in 2025.
SOL trades at $83.40 on March 31, down 77% from its all-time high, as US spot ETFs bleed for a third straight day and the biweekly 0.618 Fibonacci zone that preceded Solana’s rally to $295 sits just below current price.
SOL Daily Chart: Supertrend Holds As SAR Caps The Recovery
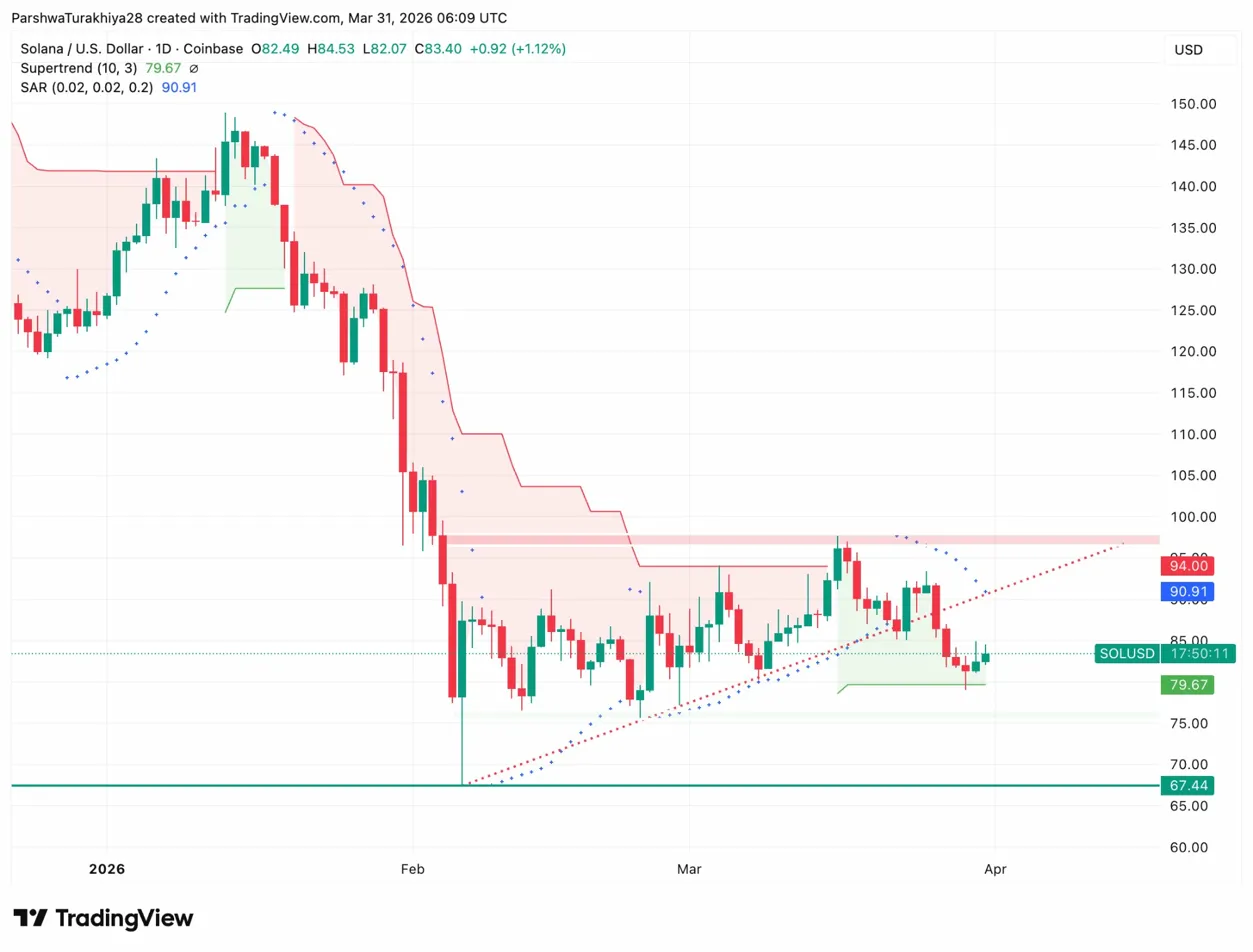
SOL bottomed at $67.44 in February and has been building higher lows since. The ascending dotted trendline from that low is rising toward current price near $83, and the Supertrend at $79.67 has been below price since mid-March providing a rising floor.
The SAR at $90.91 sits overhead and has been bearish since February, capping every recovery attempt. Price has not closed above $94 since the mid-March spike, and the resistance zone between $94 and $100 has rejected SOL four times.
The daily structure is a series of lower highs against higher lows, a compression that typically resolves with a directional break. The ascending trendline and the Supertrend together create a floor that has held for six weeks. Losing $79.67 on a daily close removes both supports simultaneously and puts $67.44 back in view.
Key Levels for SOL (April 2026)
| Level | Value | Role |
| Supertrend support | $79.67 | Critical daily floor |
| Ascending trendline | $82 to $84 | Near-term support |
| SAR resistance | $90.91 | First resistance |
| Resistance zone | $94 to $100 | Major overhead zone |
| February low | $67.44 | Downside target |
| Biweekly 0.618 Fib | $52.11 to $72.55 | Macro support zone |
SOL ETF Outflows: Three Straight Days Of Institutional Exits
US SOL spot ETFs recorded $6.17M in outflows on March 30, entirely from Bitwise’s BSOL which saw $6.17M leave in a single session. The day before saw $7.84M exit, and March 26 recorded $1.04M in outflows.
Three consecutive negative days have pulled cumulative net inflows back to $979.37M, moving the $1B milestone further away after it looked close two weeks ago. Total net assets have dropped to $801.91M from a high of $936.95M on March 17.
The outflow trend across the second half of March is consistent and accelerating. March 16 was the last meaningful inflow day at $17.81M, and the ETF data has been either flat or negative every day since.
SOL Derivatives: Volume Rising But OI Falling
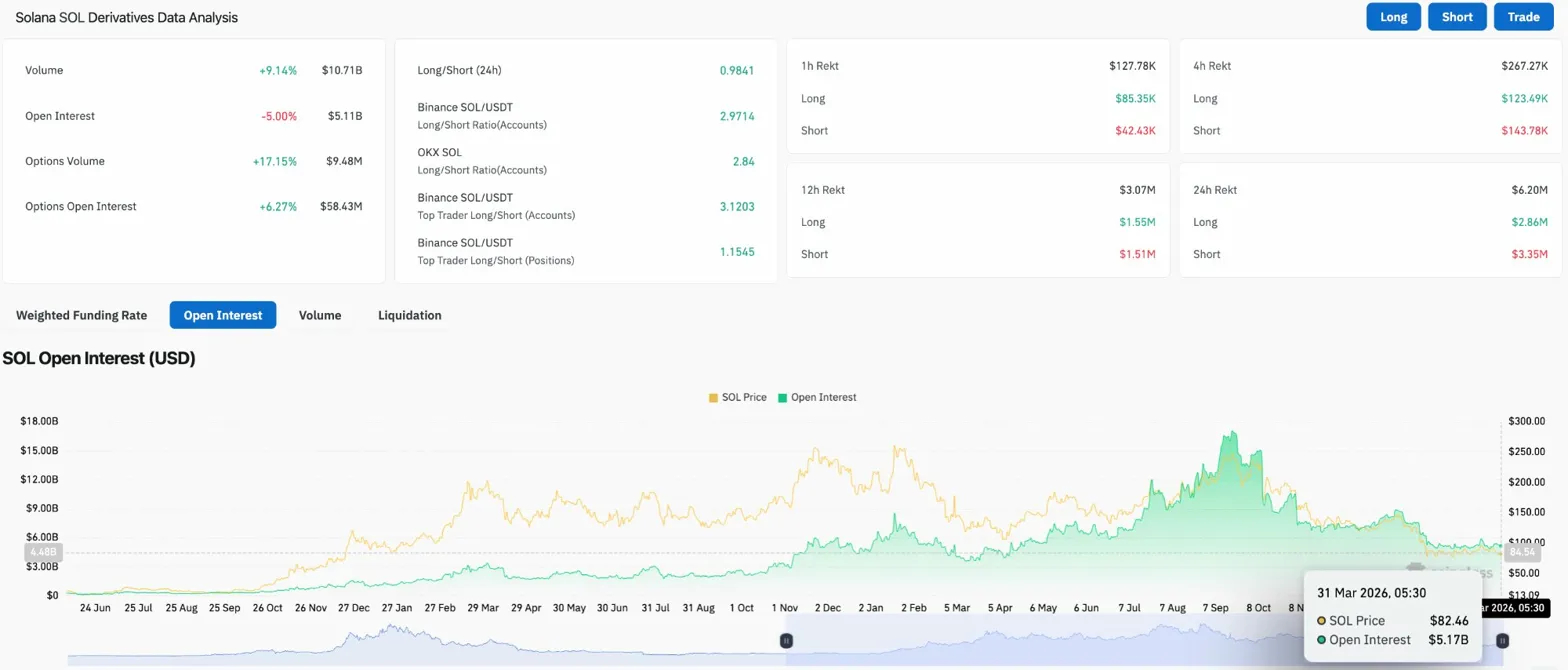
Futures volume rose 9.14% to $10.71B while OI dropped 5% to $5.11B. Volume up and OI down is a specific combination that points to position closures rather than fresh entries. Traders are taking profits or cutting losses rather than adding new directional bets. Options volume climbed 17.15% to $9.48M and options OI rose 6.27% to $58.43M, suggesting some traders are shifting from outright futures to hedged options positions ahead of April.
The Binance long/short ratio sits at 2.9714, heavily skewed toward longs. Top trader accounts lean even further at 3.1203. Yet the 24h liquidation data shows $2.86M in longs wiped against $3.35M in shorts, with shorts actually absorbing more pain over the full day. That short liquidation is mildly constructive but does not override the broader OI decline, which reflects net position reduction rather than accumulation.
The Biweekly Case: Is SOL At A Generational Entry Point?
Analyst CryptoPatel published a biweekly SOL chart this week noting that Solana has dropped 77% from its all-time high and is now sitting near the 0.618 Fibonacci support zone between $52.11 and $72.55. He identified this zone as a support and entry area, with targets at $500 and $1,000, and an accumulation range of $45 to $75.
The biweekly chart puts the current price action in a different context from the daily. The 0.618 Fibonacci level at $52.11 to $72.55 sits below current price, meaning SOL has not yet reached the deepest part of the support zone. If the daily Supertrend at $79.67 gives way and the February low at $67.44 breaks, the biweekly support zone becomes the relevant reference. The same Fibonacci level in the 2022 to 2023 cycle marked the floor before the rally to $295. Whether it repeats depends on factors well beyond the chart, but the structural parallel is worth noting as April begins.
Solana Price Prediction: What April Needs To Deliver
- Upside Scenarios To Watch In April: Hold $79.67 on the daily and the ascending trendline stays intact. Reclaim the SAR at $90.91 on a daily close and the resistance zone at $94 to $100 becomes the April test. ETF outflows reversing positive and OI recovering above $5.5B would confirm institutional positioning is returning. A clean break above $100 opens the path toward the biweekly targets over a longer timeframe.
- Downside Scenarios To Watch In April: Lose $79.67 and the compression resolves to the downside. The February low at $67.44 is the first stop, and below that the biweekly 0.618 Fibonacci zone between $52.11 and $72.55 becomes the macro support. With ETF outflows accelerating and OI declining, a break below $79.67 without a catalyst to reverse the flow picture would move quickly.
Disclaimer: The information presented in this article is for informational and educational purposes only. The article does not constitute financial advice or advice of any kind. Coin Edition is not responsible for any losses incurred as a result of the utilization of content, products, or services mentioned. Readers are advised to exercise caution before taking any action related to the company.
 Price Prediction: Can Bulls Sustain the $0.045 Push?")


