
- Solana tests symmetrical triangle apex at $88 as open interest drops 2.04% to $5.20 billion amid consolidation.
- ETFs hold $1.5B in cumulative flows despite SOL dropping 57% since July launch, with 50% from institutional investors.
- Volume collapses 27.43% to $13.18 billion while Chaikin Money Flow at -0.06 shows minimal distribution pressure.
Solana price today trades near $88.42, down 0.41% after consolidating within a symmetrical triangle that has compressed since early March. The move places buyers and sellers in equilibrium as ETF flows demonstrate institutional resilience despite steep price declines.
Open Interest Drops 2.04% As Volume Collapses
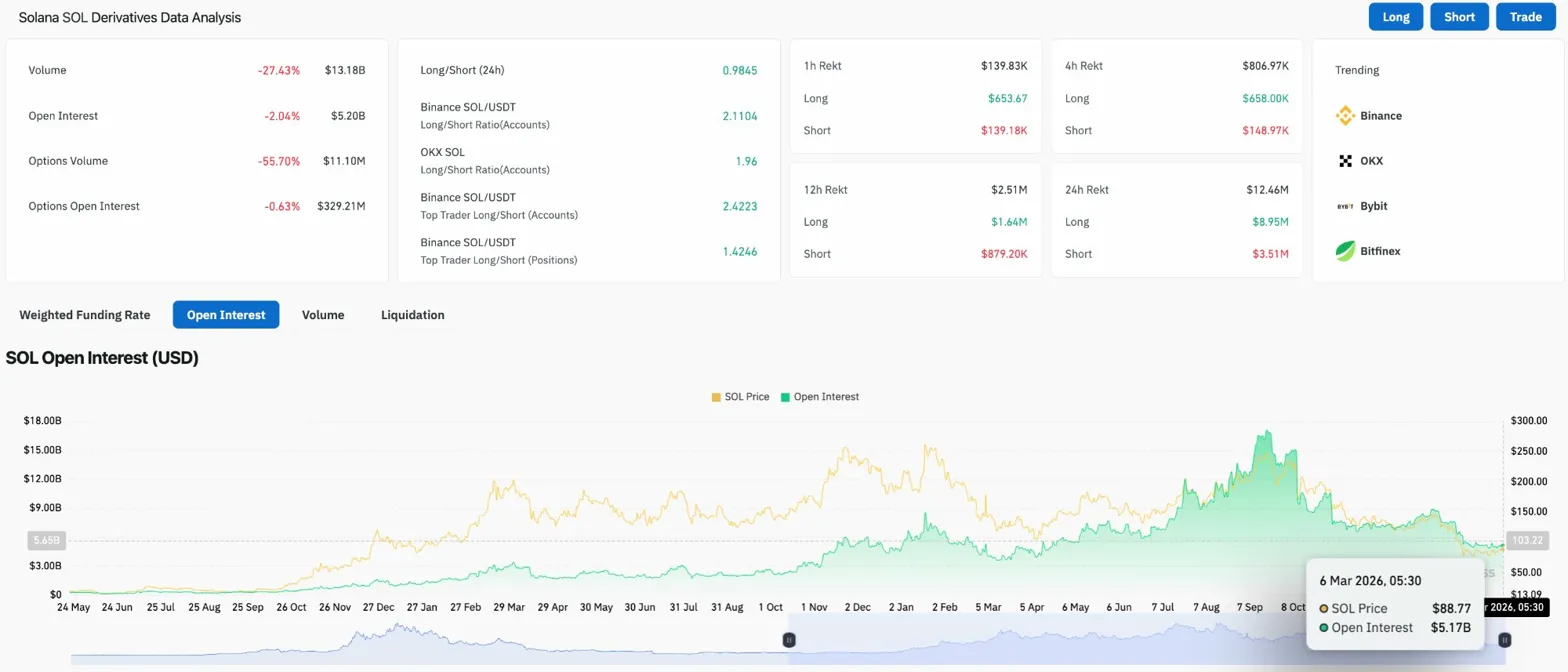
Open interest declined 2.04% to $5.20 billion while volume collapsed 27.43% to $13.18 billion, signaling reduced participation as price consolidates near the triangle apex. The long/short ratio on Binance sits at 2.11 for accounts and 2.42 for top traders, showing leverage remains tilted bullish.
Total liquidations hit $806.97K, with longs accounting for $658.00K. Options volume dropped 55.70% to $11.10 million while options OI fell 0.63% to $329.21 million, reflecting minimal hedging activity as traders await the triangle breakout direction.
Daily Chart Shows Multi-Month Support Zone Defense
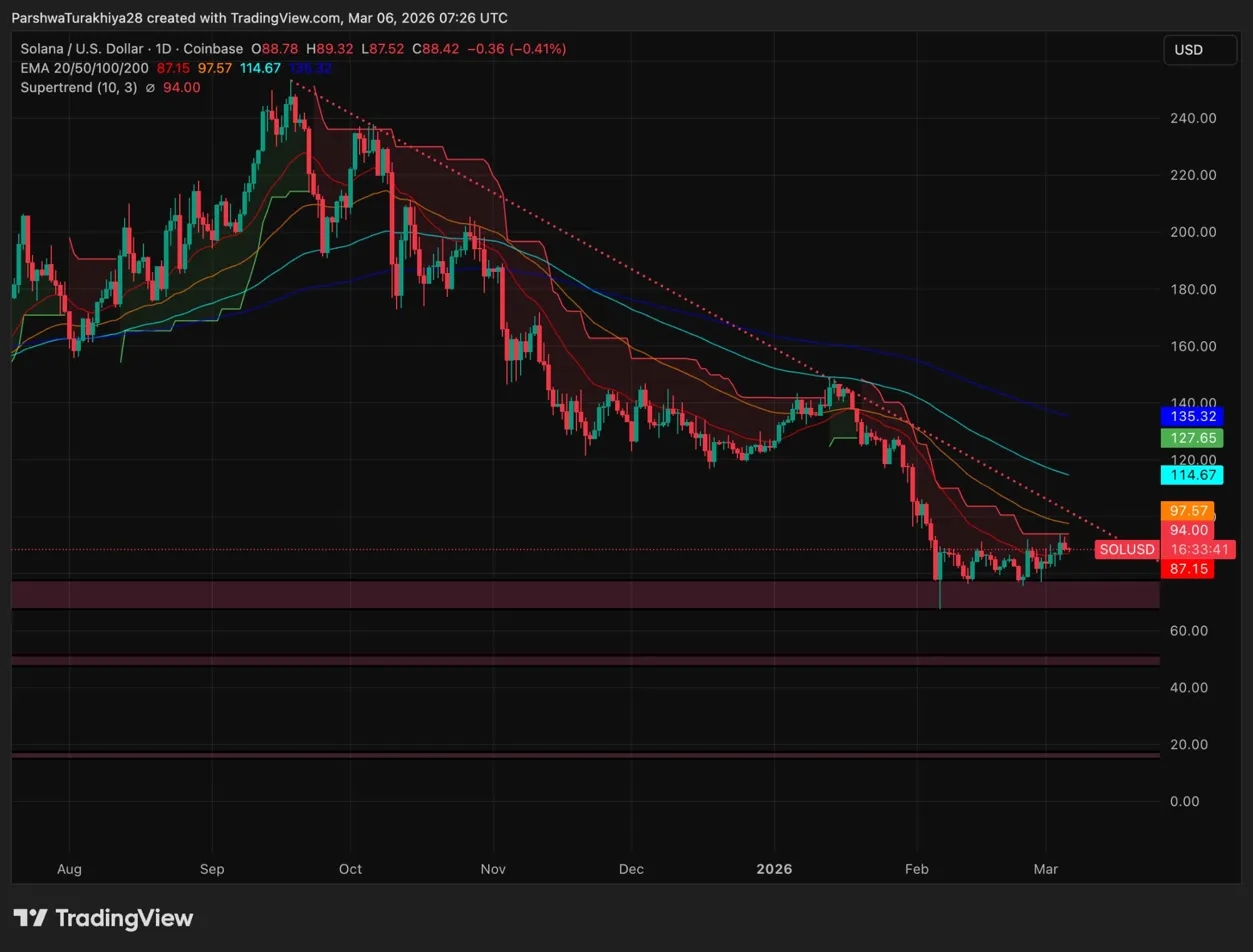
The daily chart shows Solana defending the $80 to $90 support zone (purple shaded areas) that has acted as a floor since the February spike low. Price is trading below all four major EMAs, with the 20-day at $87.15, 50-day at $97.57, 100-day at $114.67, and 200-day at $136.32 forming a descending resistance ladder.
The Supertrend at $94.00 sits above current price, confirming bearish momentum on the daily timeframe. A descending trendline (red dotted line) has capped rallies since September 2024 highs near $260.
Key levels:
- Immediate support: $85 to $87
- Critical floor: $75 to $80 (purple zone)
- First resistance: $94.00 (Supertrend)
- Triangle upper boundary: $90 to $92
30-Minute Chart Shows Symmetrical Triangle Compression
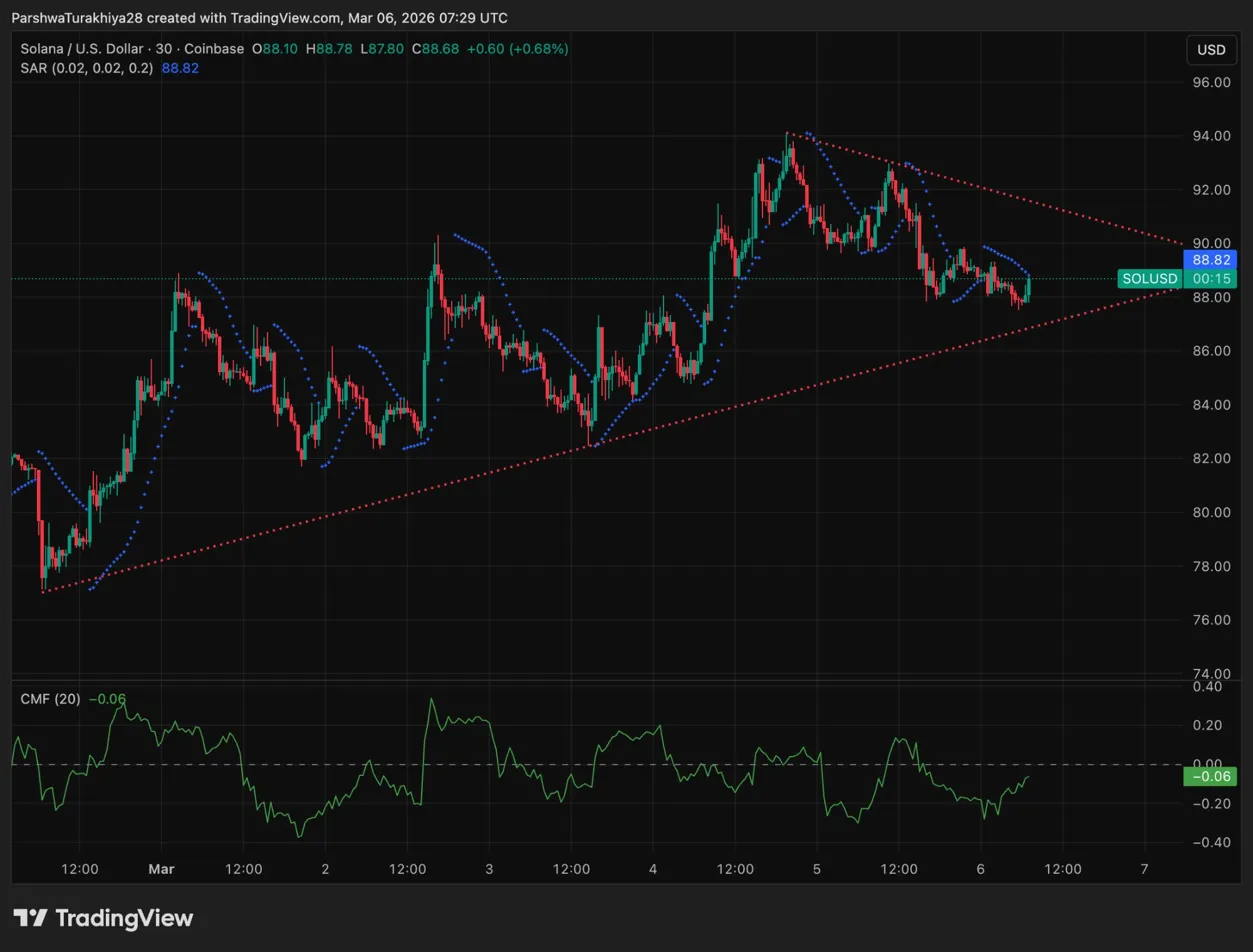
The 30-minute chart shows Solana compressing within a symmetrical triangle (red converging lines) that has tightened over the past week. The Parabolic SAR at $88.82 acts as immediate resistance, while the lower triangle boundary near $86 provides dynamic support.
Related: Cardano Price Prediction: Bulls Test Channel Resistance as ADA Enters Swiss Retail Payments
The Chaikin Money Flow sits at -0.06, showing minimal selling pressure despite the price decline. When CMF hovers near zero during consolidation, it reflects balanced buying and selling with no clear directional conviction.
A break above the upper triangle boundary near $90 to $92 would project a measured move target toward $98 to $100. A breakdown below $86 exposes the February spike low at $75 to $78.
ETFs Hold $1.5B Despite 57% Price Decline
Bloomberg ETF analyst Eric Balchunas noted March 6 that Solana ETFs have accumulated $1.5 billion in flows and “not really given any of it up” despite SOL dropping 57% since the funds launched in July. Institutional investors account for 50% of the inflows, demonstrating serious investor commitment.
Adjusting for market capitalization differences, Solana’s $50 billion market cap to Bitcoin’s $1.4 trillion, Solana ETFs have seen the equivalent of $54 billion in net flows, approximately double where Bitcoin ETFs were at the same point.
Balchunas called the numbers “pretty impressive” given ETFs launching into a market downturn usually make it “near impossible to get inflows.” Most ETFs wouldn’t survive going down 57% in the first six months, with Solana “defying physics.”
Solana ETFs saw their first net outflow day in over a month on Thursday with $6 million exiting, following a $19 million inflow day on Wednesday. The ability to retain cumulative flows despite a 70% decline from January 2025 all-time highs near $293 shows institutional resilience.
Outlook: Will Solana Go Up?
The next move depends on whether Solana can break above the triangle resistance or if sellers push through support at the apex.
- Bullish case: Solana breaks above $90 with sustained volume and ETF inflows. That confirms the triangle breakout and targets the measured move projection at $98 to $100, with potential continuation toward the Supertrend at $94.
- Bearish case: A breakdown below $86 invalidates the triangle support and exposes the $80 to $75 demand zone. Losing that level opens the door to $70 and potentially the February spike low near $67.
Disclaimer: The information presented in this article is for informational and educational purposes only. The article does not constitute financial advice or advice of any kind. Coin Edition is not responsible for any losses incurred as a result of the utilization of content, products, or services mentioned. Readers are advised to exercise caution before taking any action related to the company.
 Price Prediction: Canton Eyes Key Break After Market Activity Spike")


