
- Solana gains 1.32% to $101.99 after bouncing from the $95.83 session low as Jupiter’s Polymarket integration boosts ecosystem sentiment.
- Spot outflows hit $39.20 million on February 2, showing distribution continues despite the recovery bounce from multi-month lows.
- Recovery requires reclaiming $121.45, while a close below $95 opens downside toward the $85 demand zone.
Solana price today trades near $101.99 after rebounding from a session low at $95.83, its lowest level since July 2025. The recovery comes as Jupiter announced it will bring Polymarket to Solana for the first time, alongside a $35 million strategic investment from ParaFi Capital that signals institutional confidence in the ecosystem.
Jupiter Polymarket Integration Shifts Narrative
Jupiter announced a landmark integration that will bring Polymarket, the largest prediction market in crypto, to Solana for the first time. The deal positions Jupiter as a comprehensive on-chain predictions hub alongside its existing swap functionality.
The announcement came with a $35 million strategic investment in JUP from ParaFi Capital, settled entirely in JupUSD with an extended token lockup. Jupiter’s pseudonymous co-founder meow said prediction markets will be a major focus over the next year, with planned work spanning APIs and revamped market discovery tools.
Jupiter’s on-chain footprint supports the expansion. Total value locked sits at $2.35 billion with annualized fees near $650 million and protocol revenue around $150 million. The Polymarket integration could drive additional users and liquidity to Solana as prediction markets continue gaining traction.
Spot Outflows Persist Despite Positive Catalyst
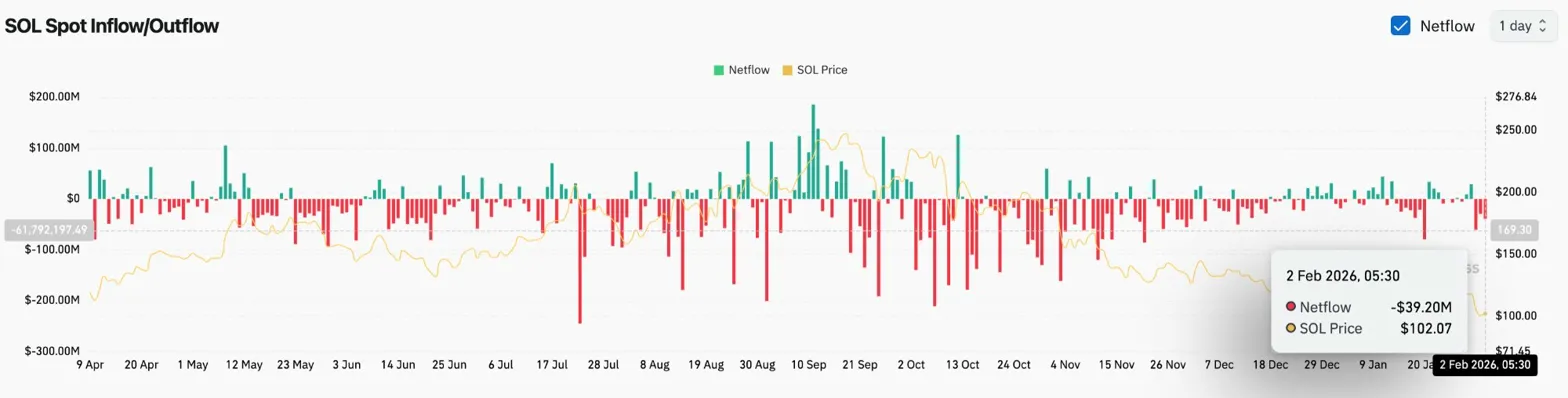
Coinglass data shows $39.20 million in spot outflows on February 2, continuing the distribution pattern that has defined the past several weeks. The selling pressure suggests that holders are using any bounce to reduce exposure rather than accumulating at lower levels.
The divergence between positive fundamental developments and negative spot flows highlights the broader risk-off environment affecting all altcoins. When ecosystem catalysts fail to attract fresh buying, it signals that macro sentiment remains the dominant driver of price action.
Price Tests Critical Long Term Support Zone
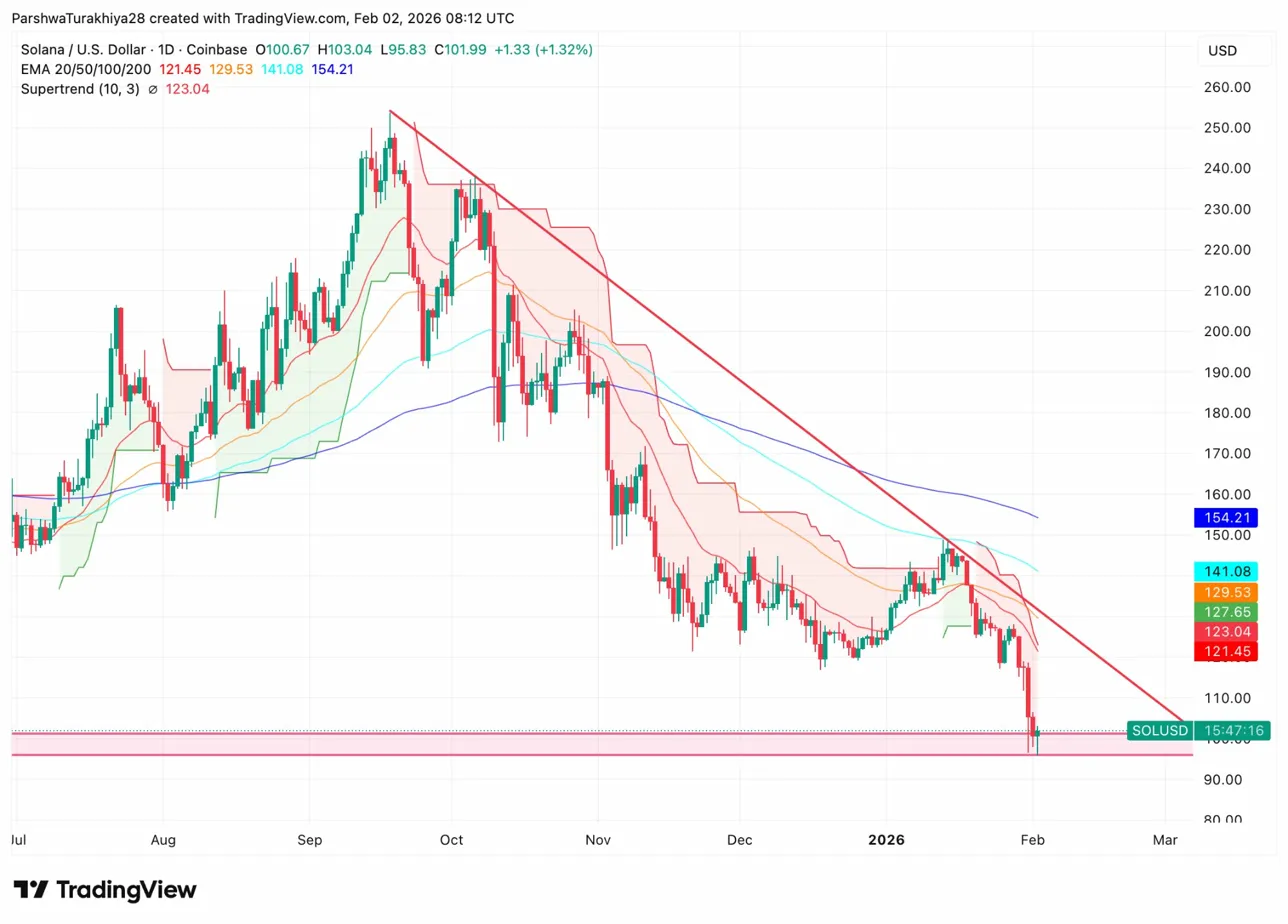
On the daily chart, Solana has broken below the descending trendline support that held since November, accelerating into a key horizontal support zone near $100. Price trades well below all four major EMAs, with the 20 day at $121.45, the 50 day at $129.53, the 100 day at $141.08, and the 200 day at $154.21.
Related: Hyperliquid Price Prediction: Can HYPE Reclaim $32.00 or Is Deeper Consolidation Ahead?
The Supertrend indicator remains bearish at $123.04, confirming the downtrend that began from the September highs near $260. The current price represents a 60 percent decline from those peaks.
The $95 to $100 zone represents critical support that held during the November correction. A break below this level would expose the $85 demand zone from July 2025, where SOL found buyers during the summer consolidation.
Short Term Structure Shows Descending Channel
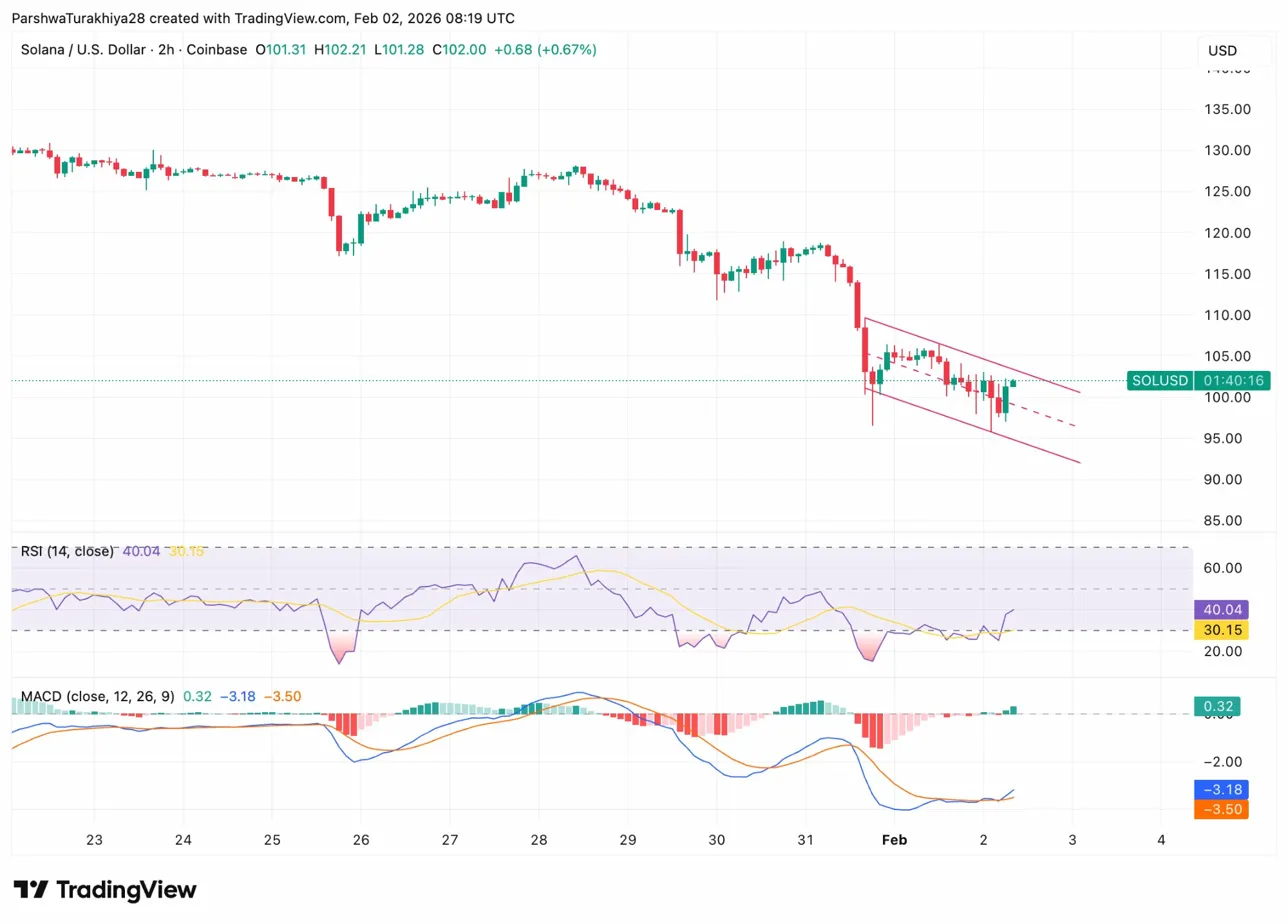
On the 2 hour chart, Solana trades within a descending channel that has guided price action since January 30. The channel resistance sits near $105, while support runs through the $95 zone.
RSI has recovered to 40.04 from oversold levels near 30.15, suggesting the immediate selling pressure has eased. MACD shows the histogram turning positive at 0.32, with the signal lines beginning to converge, indicating momentum may be shifting.
The bounce from $95.83 has produced higher lows on the intraday timeframe, but price remains within the descending channel structure. Bulls need a break above channel resistance at $105 to signal any meaningful reversal attempt.
Outlook: Will Solana Go Up?
The trend remains bearish while price trades below the EMA cluster, but the $95 to $100 support zone offers a potential base for stabilization.
- Bullish case: A daily close above $121.45 would reclaim the 20 day EMA and signal that the $95 low marked a local bottom. The Jupiter catalyst could attract buyers if broader crypto sentiment improves.
- Bearish case: A close below $95 would break the 2025 support structure and expose the $85 demand zone. With spot outflows persisting and macro headwinds intact, that scenario remains probable.
Disclaimer: The information presented in this article is for informational and educational purposes only. The article does not constitute financial advice or advice of any kind. Coin Edition is not responsible for any losses incurred as a result of the utilization of content, products, or services mentioned. Readers are advised to exercise caution before taking any action related to the company.


