
- SOL trades at $86.14, down 0.25%, breaking below the rising triangle support that held since the February low at $67.44.
- US SOL spot ETFs recorded $1.04M in outflows on March 26, pulling cumulative inflows back to $993.38M after briefly touching $994M.
- Exchange netflow data shows $39.21M in net outflows over the past three days, meaning SOL is leaving exchanges faster than it is arriving.
SOL trades at $86.14 on March 27, slipping below the rising triangle that had been the backbone of its recovery since February. The break is not dramatic yet, but the 4H-chart is projecting a measured move toward $67.44 if support does not reclaim quickly. ETF flows flipped negative on March 26 after a week of flat to modest inflows, and exchange data shows consistent outflows over three days.
SOL Price Chart: Rising Triangle Breaks At A Critical Level
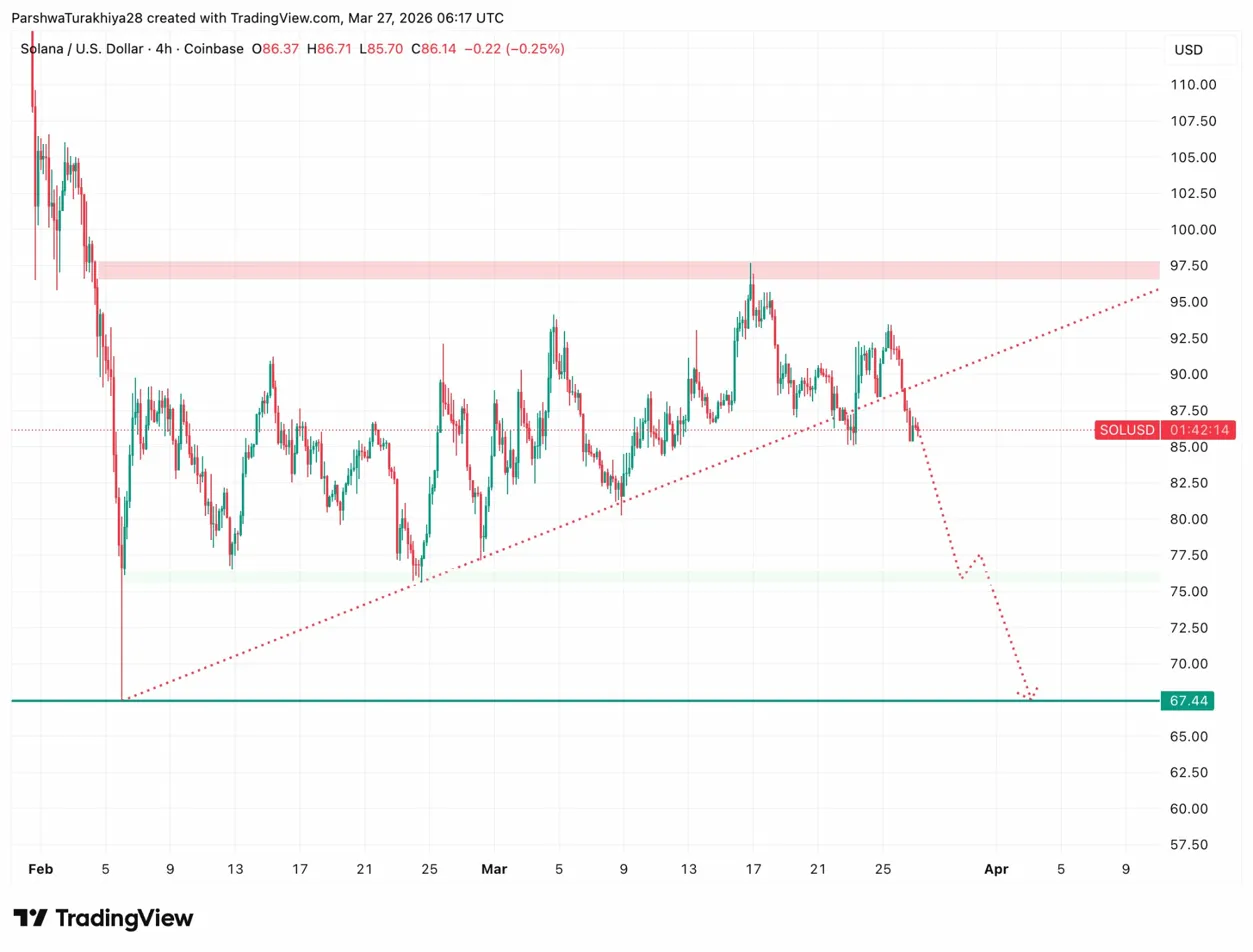
SOL bottomed at $67.44 in early February and built a rising triangle through March, with higher lows along the ascending support line and a flat ceiling near $97.50. The March 17 high touched $97.50, failed to break through, and price has been sliding since.
Related: Cardano Price Prediction: ADA Tests $0.25 As Midnight Lands First UK Bank Deal
On March 26, SOL broke below the ascending trendline near $87.50, which had been support for six weeks. Price is now trading below it at $86.14, and the dotted projection lines on the chart show a measured move toward $67.44 if the breakdown holds. The $85 area is the last meaningful support before open air down to that level. A reclaim of $87.50 on a 4h close would neutralize the breakdown and put $92 back in view.
| Level | Value | Role |
| Broken triangle support | $87.5 | Now resistance |
| Current support | $85 | Last line before flush |
| Resistance zone | $97.5 | Triangle ceiling |
| Measured move target | $67.44 | Downside if $85 breaks |
| Recovery target | $92 | If $87.50 reclaimed |
SOL Exchange Flows And ETF Data Signal Caution
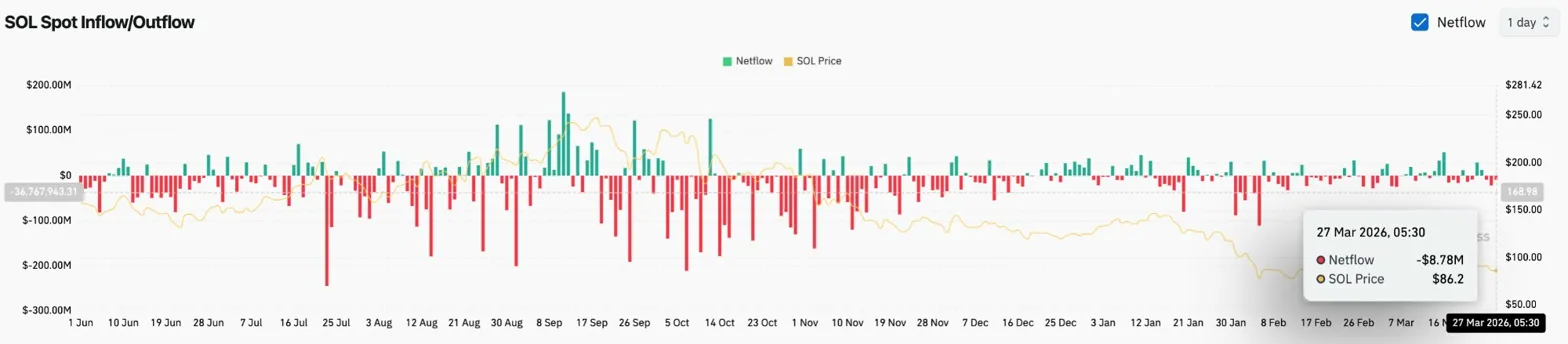
Exchange netflow data shows $39.21M leaving Solana over the past three days including today. On March 27 alone, netflow reads -$8.78M. Consistent outflows from exchanges typically mean holders are moving SOL to cold storage rather than positioning to sell, which is usually a bullish long-term signal. In the short term though, with price breaking triangle support, reduced exchange liquidity can amplify moves in either direction.
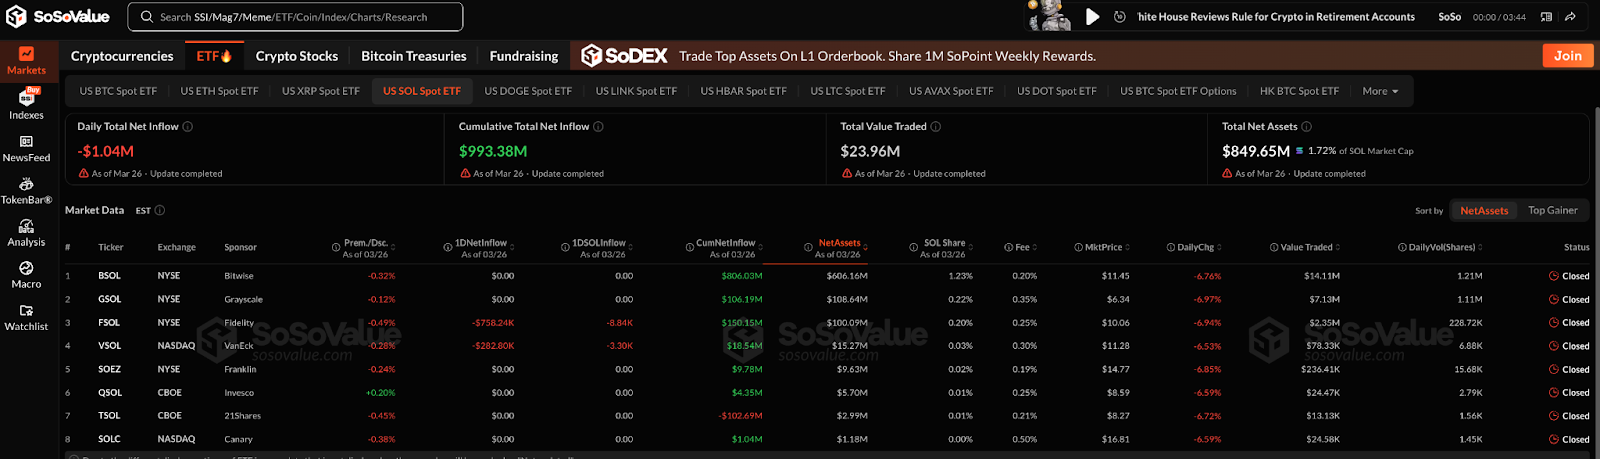
The ETF picture shifted on March 26. After recording $4.64M in inflows on March 24 and flat flows on March 25, the US SOL spot ETFs posted $1.04M in outflows on March 26, pulling cumulative net inflows back to $993.38M. Total net assets dropped to $849.65M. Fidelity’s FSOL saw the largest single-day outflow at $758.24K, and VanEck’s VSOL lost $282.80K. No fund recorded a positive day. The $1B cumulative milestone that looked close earlier this week has moved further away.
Why The Alpenglow Upgrade Could Change Solana’s Trajectory
Solana’s most significant protocol overhaul is in the pipeline. The Alpenglow upgrade targets throughput, fee dynamics, and decentralization, directly addressing the congestion episodes that hurt the network’s credibility in 2023. A 2025 governance vote saw roughly 98% of token holders back it.
Transaction volumes have been hitting record highs into late March, driven by high-frequency trading bots and automated market makers built on Solana’s sub-second finality. Asset managers are running pilot programs for tokenized asset custody on the network. The meme coin narrative is fading. What is replacing it is an on-chain AI agent economy where autonomous entities manage treasuries and liquidity pools directly on Solana infrastructure. None of this fixes the chart today. But it explains why institutional capital has not left.
Where Does SOL Go From Here?
The triangle breakdown is the dominant setup right now. Reclaim $87.5 on a 4h close, and the breakdown gets invalidated. From there $92 is the first target, then $97.5 at the triangle ceiling. ETF inflows returning positive and exchange outflows stabilizing would confirm the recovery.
Hold below $87.50 and $85 becomes the decision point. Lose $85 on a daily close with ETF flows still negative and the measured move to $67.44 becomes the working thesis. Exchange outflows reducing liquidity on the way down means the move could be faster than the February collapse.
Disclaimer: The information presented in this article is for informational and educational purposes only. The article does not constitute financial advice or advice of any kind. Coin Edition is not responsible for any losses incurred as a result of the utilization of content, products, or services mentioned. Readers are advised to exercise caution before taking any action related to the company.


 Price Prediction: MemeCore Surges 39% as Momentum Builds Toward $3")
