
- Solana falls 10.46 percent on the week to $90.13, breaking below the critical $100 psychological level and the $114 support that held since 2024.
- Long liquidations hit $66.96 million in 24 hours as leveraged positions collapse, with open interest dropping 2.92 percent to $6.17 billion.
- Recovery requires reclaiming $114.37, while a close below $89 opens downside toward the $51 demand zone marked on the weekly chart.
Solana price today trades near $91.42 after breaking below the psychological $100 level for the first time since July 2025. The move represents a 65 percent decline from September highs near $260 and confirms a structural breakdown on the weekly timeframe that puts significantly lower levels in play.
$71 Million Liquidation Cascade Flushes Longs
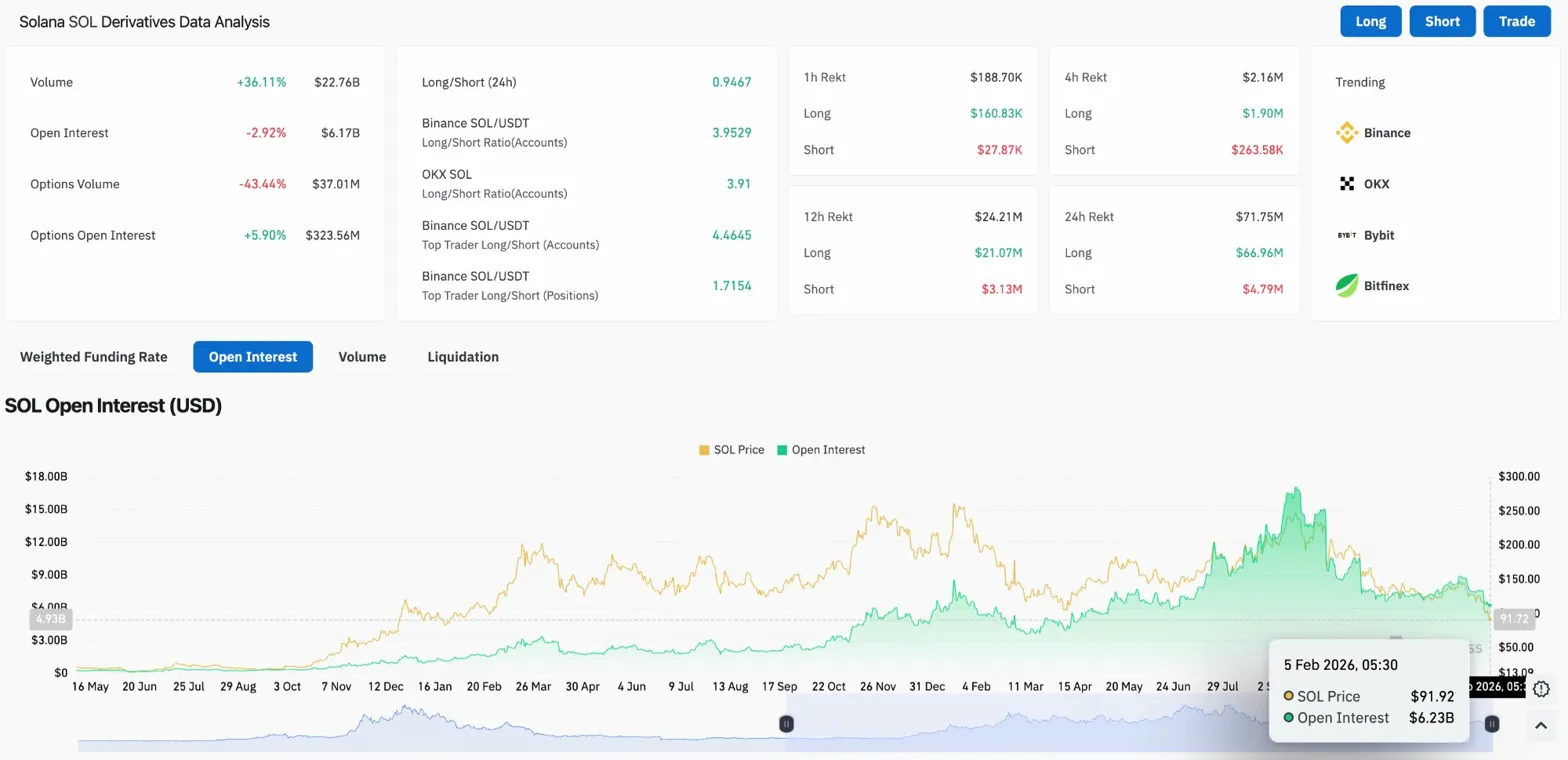
The derivatives market experienced a brutal flush over the past 24 hours. Total liquidations reached $71.75 million, with $66.96 million coming from long positions and just $4.79 million from shorts. The 14x imbalance shows leveraged bulls were caught heavily offside as price crashed through support.
Open interest dropped 2.92 percent to $6.17 billion while volume surged 36.11 percent to $22.76 billion. The combination of falling open interest and rising volume confirms forced position closures rather than new short entries.
On Binance, top trader long/short ratio by accounts sits at 4.46, showing that despite the liquidations, traders remain heavily skewed bullish. When positioning stays bullish into a breakdown, it suggests more liquidations could follow if price continues lower.
Weekly Structure Breaks Critical $114 Support
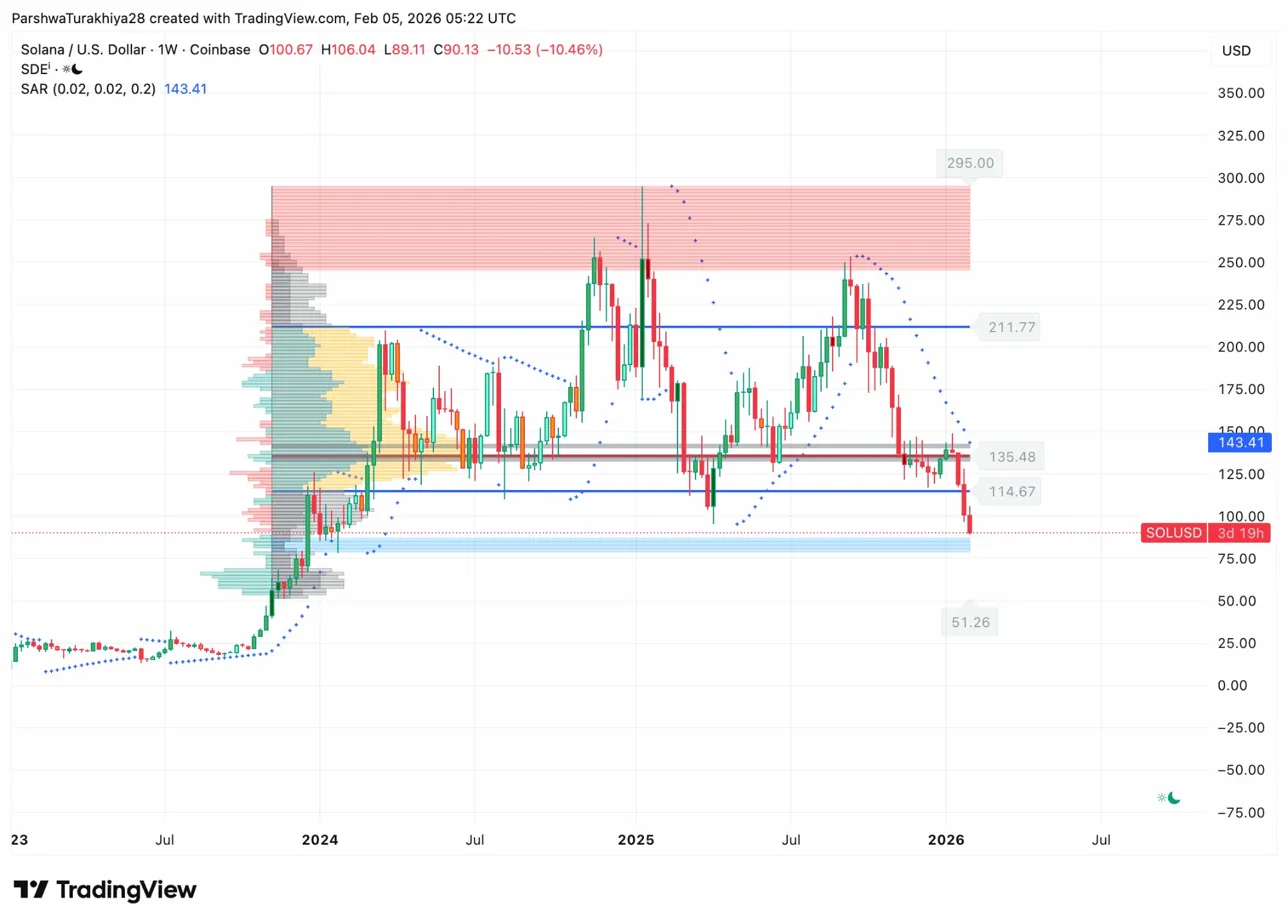
The weekly chart shows the severity of the current breakdown. Price has crashed through the $114.67 support level that defined the range low since early 2024 and the $135.48 zone that acted as both support and resistance throughout 2025.
The Parabolic SAR sits at $143.41, confirming the weekly downtrend. The volume profile on the left side of the chart shows minimal trading activity between current levels and $51.26, suggesting thin support if selling continues.
The $295 to $211 resistance zone now represents a distant target that would require a complete reversal in market structure. More immediately, the $89 level marks the session low that buyers need to defend to prevent acceleration toward the $51 demand zone.
Daily Chart Confirms Accelerating Downtrend
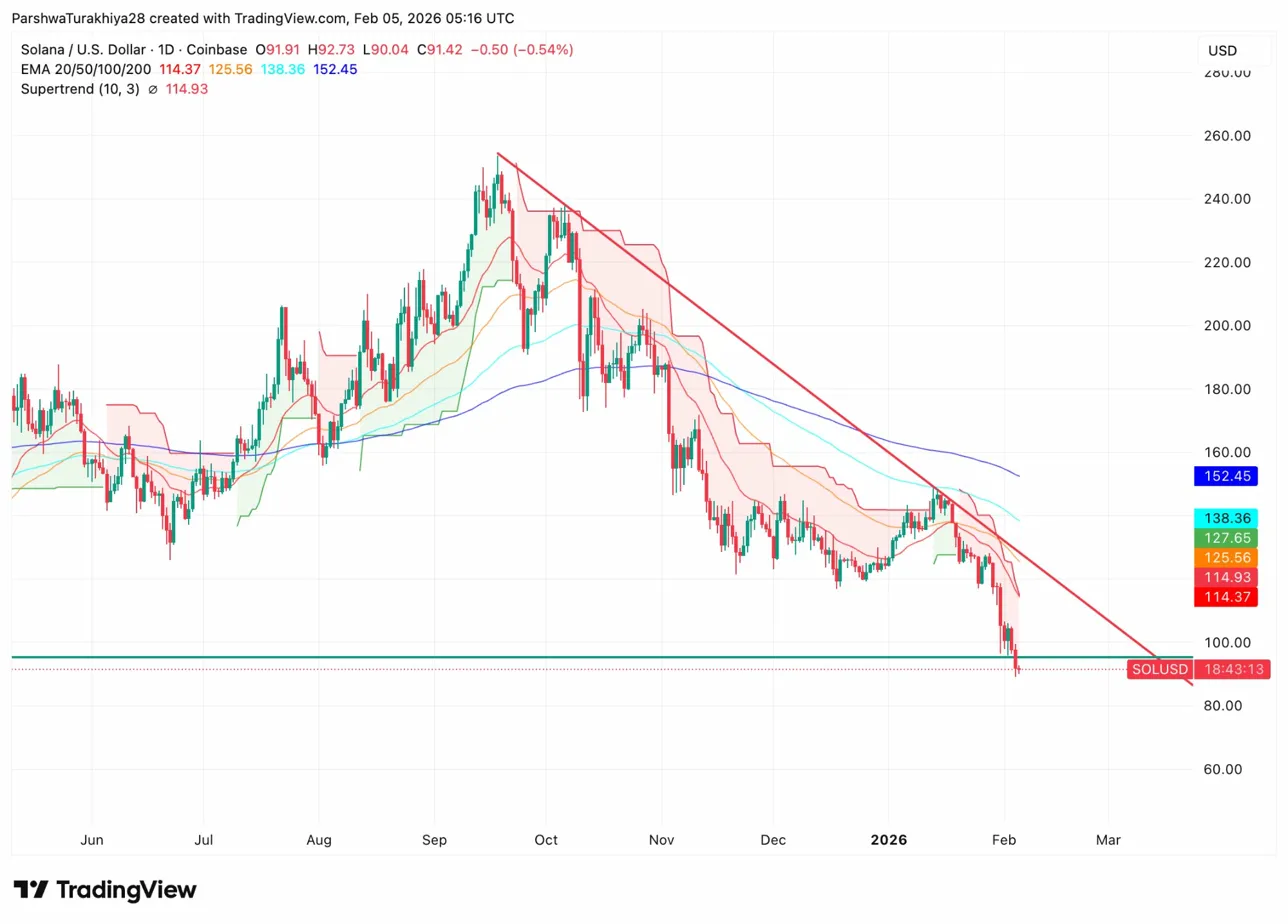
On the daily chart, Solana trades well below all four major EMAs within a descending channel that has guided price action since September. The 20 day EMA sits at $114.37, the 50 day at $125.56, the 100 day at $138.36, and the 200 day at $152.45.
The Supertrend indicator remains bearish at $114.93, aligning with the 20 day EMA as the first resistance level bulls need to reclaim. The gap between current price at $91 and the nearest EMA at $114 shows how far the market has fallen from any meaningful resistance.
The descending trendline from September continues to cap rallies, creating a series of lower highs that defines the bearish structure. Each bounce over the past four months has been sold into, and there is no technical evidence that this pattern has changed.
Spot Outflows Continue As Distribution Persists
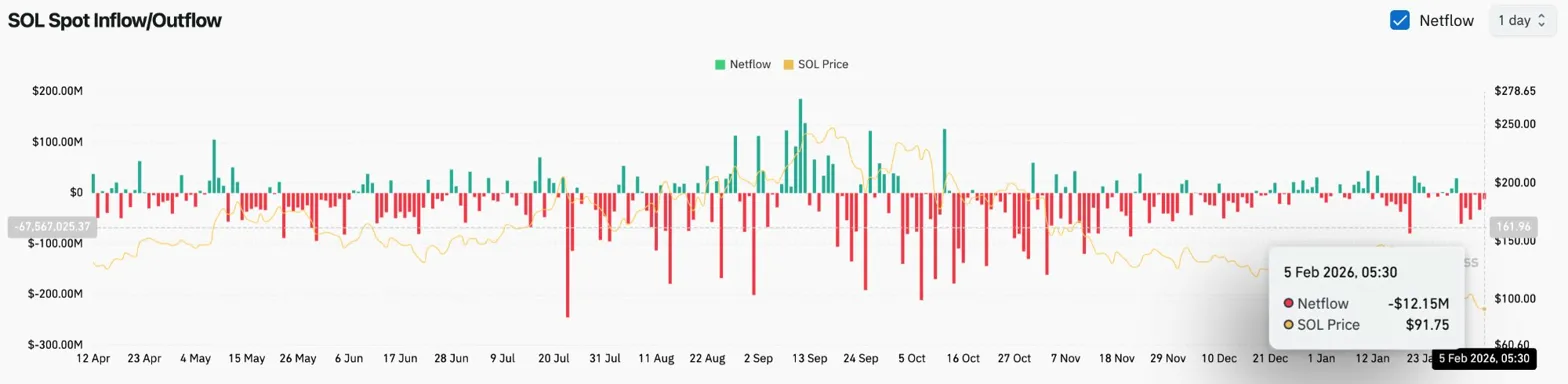
Coinglass data shows $12.15 million in spot outflows on February 5, continuing the distribution pattern that has persisted through the selloff. While the outflow magnitude is smaller than recent peak days, the direction remains negative.
The flow pattern through January and February shows consistent net outflows with no meaningful accumulation days. When spot selling persists during a crash, it signals conviction from sellers and raises questions about where natural buying demand will emerge.
The lack of inflows at current levels suggests holders are not treating the breakdown as a buying opportunity, which is typically required for a reversal to form.
Outlook: Will Solana Go Up?
The trend remains firmly bearish while price trades below all major EMAs and the weekly structure has broken down.
- Bullish case: A weekly close above $114 would reclaim the broken support and signal a potential false breakdown. That move requires a shift in broader crypto sentiment and would target the $135 resistance zone.
- Bearish case: A close below $89 would confirm continuation of the breakdown and expose the $51 demand zone visible on the weekly volume profile. With leverage still skewed bullish and spot outflows persisting, that scenario carries significant probability.
Disclaimer: The information presented in this article is for informational and educational purposes only. The article does not constitute financial advice or advice of any kind. Coin Edition is not responsible for any losses incurred as a result of the utilization of content, products, or services mentioned. Readers are advised to exercise caution before taking any action related to the company.


