
- Solana stays range-bound as repeated rejections near $145 cap momentum recovery.
- Declining open interest signals reduced leverage and cautious positioning overall.
- Persistent spot outflows highlight weak demand and ongoing distribution pressure.
Solana continues to move inside a broad consolidation phase as market conditions reset after November’s breakdown. The token holds a neutral stance within this wide structure while traders monitor volatility and positioning. Besides, the price still trades below several major trend indicators, which keeps sentiment cautious.
The market shows slow rebuilding after heavy liquidations earlier in the quarter. Hence, investors are now watching for confirmation before committing to directional moves. This environment keeps Solana locked between defined support and resistance levels while broader risk appetite remains muted.
Solana Trades Below Major EMAs as Consolidation Extends
Solana remains capped under its 200-EMA, which continues to act as dynamic resistance. Price also faces repeated rejections around the $137 to $145 region. This area combines trend indicators and Fibonacci retracement levels, creating a dense supply zone.
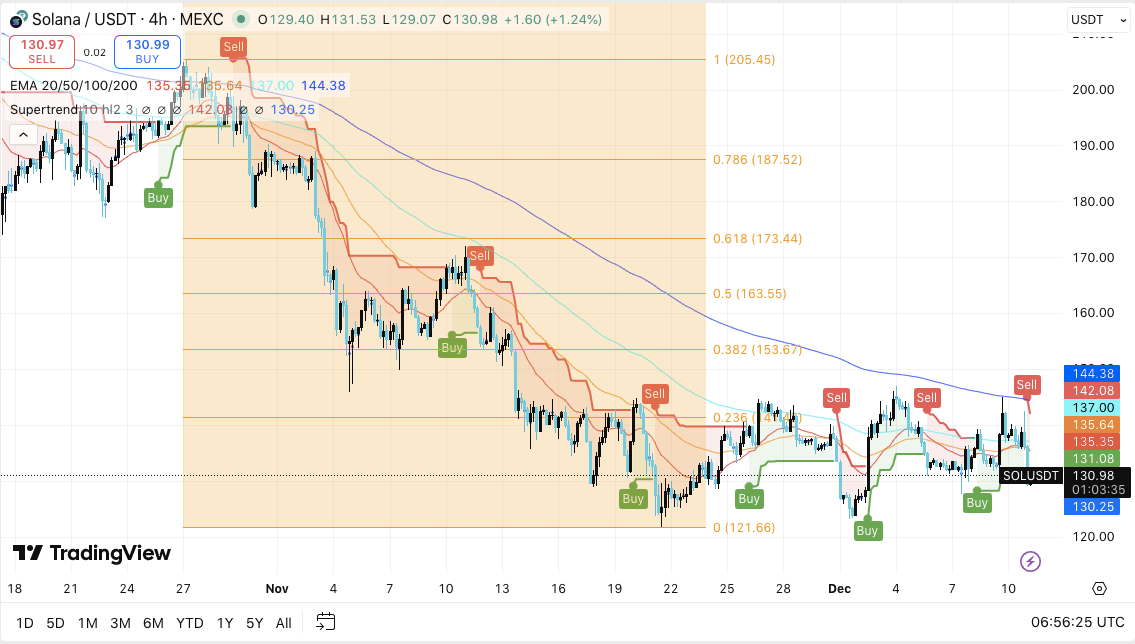
Additionally, the structure shows continued compression because lower highs press into the same ceiling. Traders see this band as the first battleground that must clear for any stronger momentum. A breakout above $145 could open space toward the $153 and $163 regions. These levels form the next checkpoints where broader trends may shift.
Support rests between $130 and $131, where recent buy signals appeared. This zone helps maintain the current trading range. However, a decisive breakdown could expose the $121 area. This level marks the cycle’s major floor and a potential reset point. Hence, traders continue to monitor how price responds to this support cluster.
Leverage Resets as Open Interest Declines From October Highs
Open interest expanded sharply through September and October as leverage increased across Solana markets. The metric climbed above $8 billion during the rally. Consequently, speculative activity rose while price attempted to form new yearly highs.
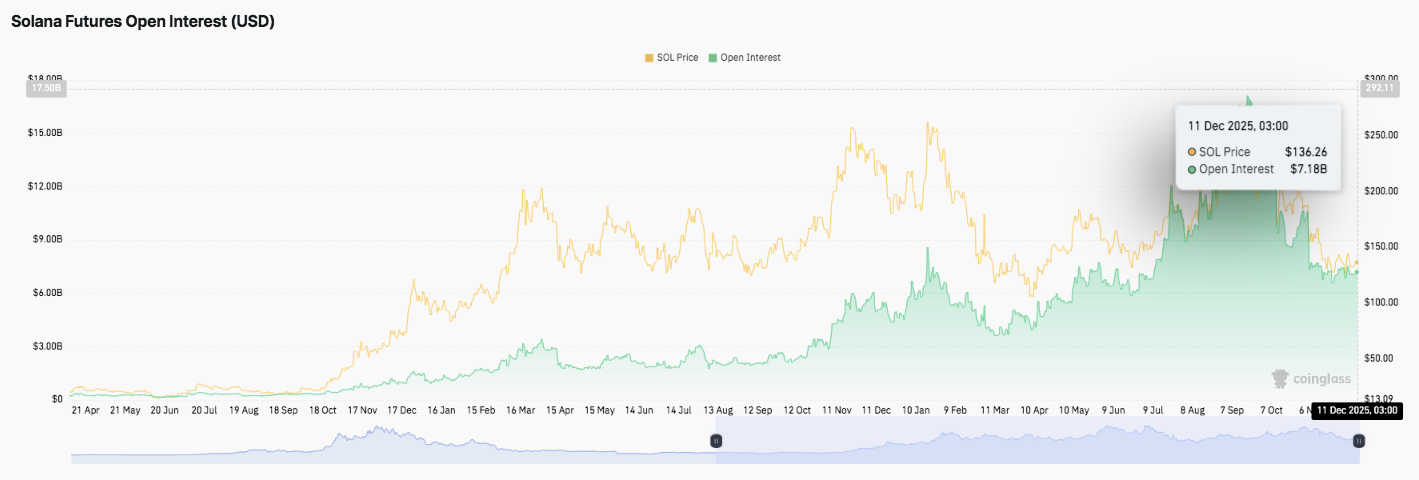
However, open interest dropped quickly in November as traders closed positions. This shift followed fading momentum and several liquidation phases. By December 11, open interest cooled to about $7.18 billion. The trend shows a cautious rebuilding phase as volatility contracts and traders reduce exposure.
Spot Flows Show Consistent Outflows and Weak Buying Pressure
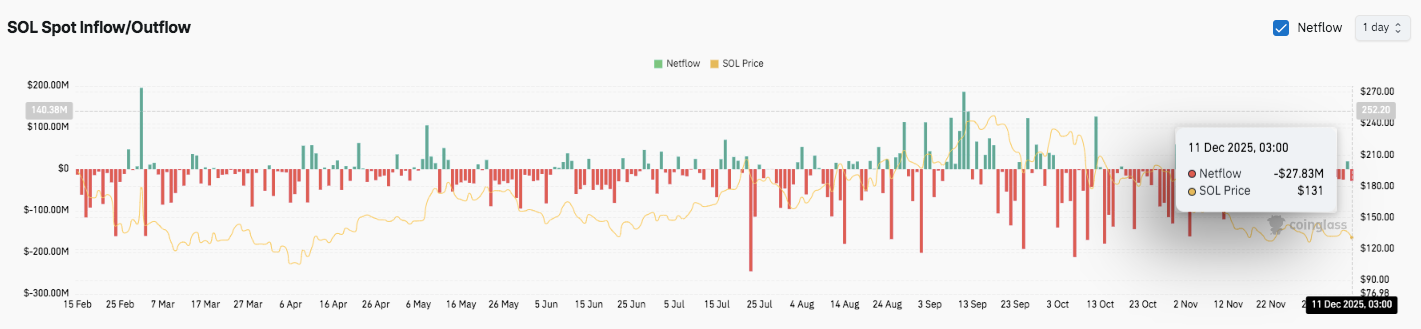
Solana’s spot flows reveal continued outflows during recent sessions. Moreover, several October and November prints exceeded $50 million in net selling.
The latest figure shows a $27.83 million outflow as price trades near $131. This pattern signals persistent distribution and reduced bid strength. Market participants continue to navigate a structure shaped by steady sell-side activity.
Technical Outlook for Solana Price
Key levels remain well-defined as Solana trades inside a broad consolidation range heading into the next market phase.
Upside levels: $137–$145 forms the first major hurdle, combining EMA resistance and a dense supply block. A breakout could extend toward $153.67 and $163.55. Continued momentum may reach $173.44 if volume strengthens.
Downside levels: $130–$131 acts as immediate support, followed by $124 and the major $121.66 cycle low.
Resistance ceiling: The 200-EMA near $144 remains the key level to flip for medium-term bullish momentum. Price continues to trade below all major EMAs, which keeps overhead pressure intact.
The technical picture shows Solana compressing inside a wide range. Volatility continues to narrow while liquidity rotates out of aggressive positions. A decisive breakout from this structure could trigger sharp expansion in either direction.
Will Solana Break Out or Break Down?
Solana’s next move depends on whether buyers can protect $130 long enough to challenge the $137–$145 resistance band. This zone controls the recovery path and anchors the entire medium-term structure. Technical compression, fading momentum, and mixed flows indicate that traders wait for confirmation before committing to strong directional exposure.
A sustained break above $145 could fuel a run toward $153 and $163, with $173 emerging if trend strength improves. However, failure to hold $130 risks a slide toward $124 and the deeper $121.66 base.
For now, Solana remains in a pivotal zone. Market conviction, liquidity behavior, and reaction around the $137–$145 ceiling will determine the next leg.
Disclaimer: The information presented in this article is for informational and educational purposes only. The article does not constitute financial advice or advice of any kind. Coin Edition is not responsible for any losses incurred as a result of the utilization of content, products, or services mentioned. Readers are advised to exercise caution before taking any action related to the company.


