
- Solana trades near $141.79 after breaking its year-long ascending trendline and failing its retest near $160.
- Spot flows stay negative with $11.66M in outflows, reinforcing the distribution trend that has dominated since early September.
- Derivatives activity rises as open interest climbs to $7.51B, while buyers attempt stabilization above intraday VWAP near $141.60.
Solana price today trades near $141.79, stabilizing after a sharp breakdown below the year-long ascending trendline that supported every major rally since early 2025. The move has shifted momentum toward sellers as spot outflows remain elevated and derivatives positioning shows leveraged traders pulling back.
Trendline Break Confirms Momentum Shift
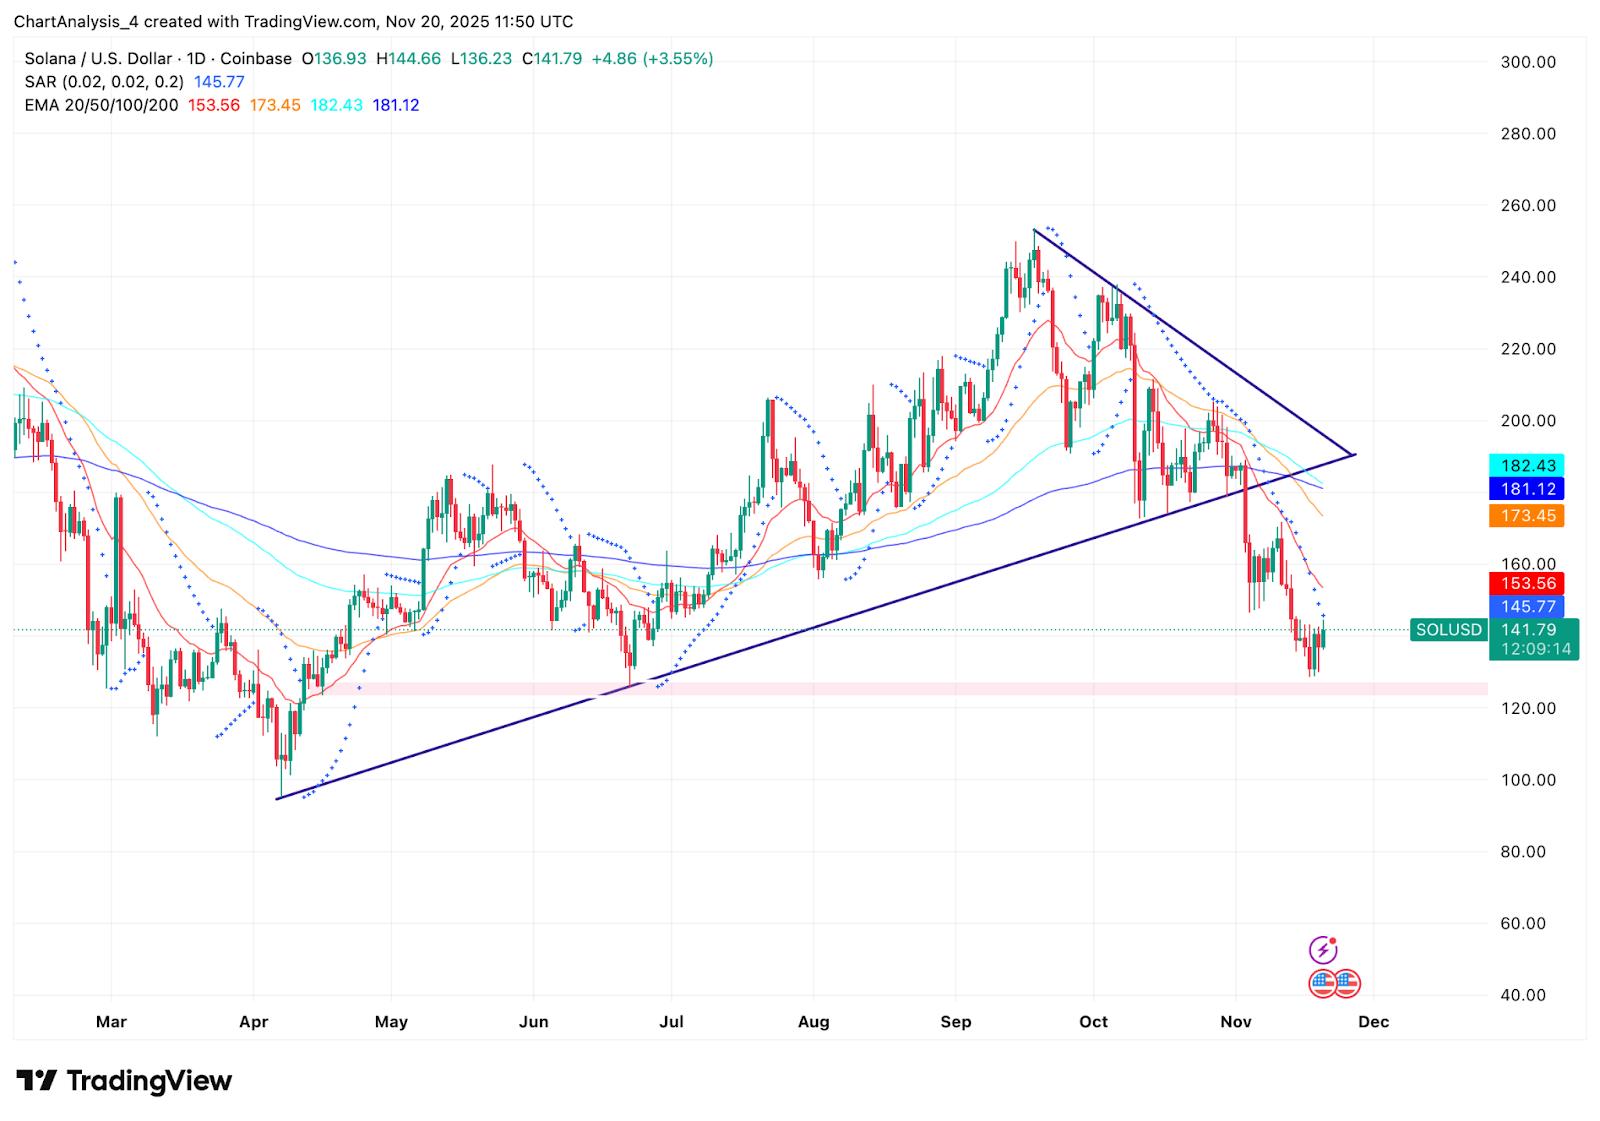
The daily chart shows a clear structural change. Solana broke decisively below the rising trendline that carried price from April to October. Once the breakdown occurred, the retest near $160 failed, and price rolled over into the current support area.
Solana now trades well below the 20 day EMA at $153.56, the 50 day EMA at $173.45, and the 100 day EMA at $182.43. All three slope downward and sit above price, creating a heavy overhead resistance band. The 200 day EMA at $181.12 marks the upper boundary of this cluster and reinforces the bearish tone.
Related: Bitcoin Price Prediction: BTC Faces Mounting Pressure as Downtrend Deepens
Parabolic SAR remains above price across daily and intraday timeframes. Sellers continue to dictate short term direction, and the absence of higher lows confirms that the market remains in a corrective phase following the break of the long ascending structure.
The current support band between $133 and $138 has held through two recent attempts to break lower. A close below this zone would mark a fresh technical deterioration.
Spot Outflows Show Sellers Still Active
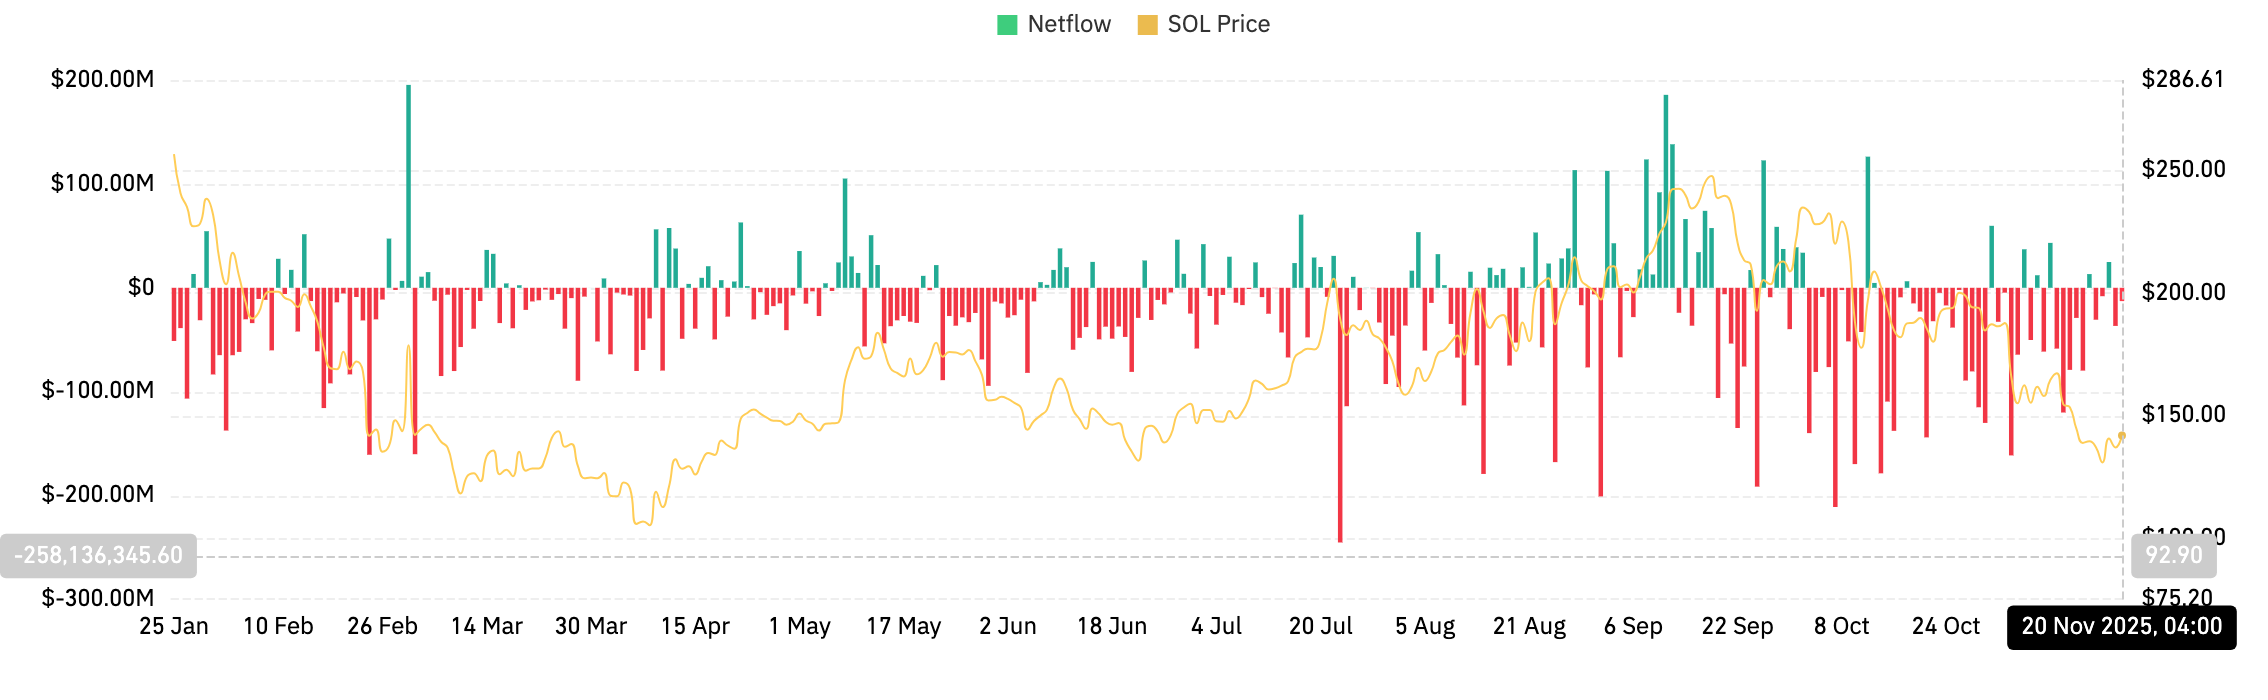
Coinglass spot flow data continues to signal distribution. Solana recorded $11.66M in net outflows on November 20, adding to a long series of negative days since early September.
This pattern has been consistent. Red bars dominate the flow profile, with sellers repeatedly sending SOL back to exchanges rather than holding or accumulating. The heaviest outflow spikes in recent months came during attempts to reclaim the EMA cluster, signaling that traders use rallies to reduce exposure.
Derivatives Positioning Builds As Open Interest Rises
Solana derivatives data presents a different picture. Futures open interest increased 3.28 percent, rising to $7.51B. The uptick in OI suggests traders are willing to add positions during the decline, though it is unclear whether these are defensive hedges or directional bets.
Volume surged 27.25 percent to $21.48B, showing strong engagement as price approached the support band. Options open interest also rose 1.81 percent, even though total options volume fell slightly.
Related: Ethereum Price Prediction: ETF Outflows Surge As Descending Trendline Blocks Every Rally Attempt
Long to short ratios show a pronounced long bias. Binance accounts show a ratio of 2.85, while top traders hold a ratio of 3.59, indicating that larger accounts remain positioned for a recovery. OKX accounts show a similar ratio of 2.04.
Liquidation data shows relatively contained activity, with $30.88M liquidated in the past day. Short liquidations accounted for $9.78M, while long liquidations totaled $21.10M. The imbalance reflects the pressure longs have faced during the trendline breakdown.
Intraday Momentum Attempts To Stabilize
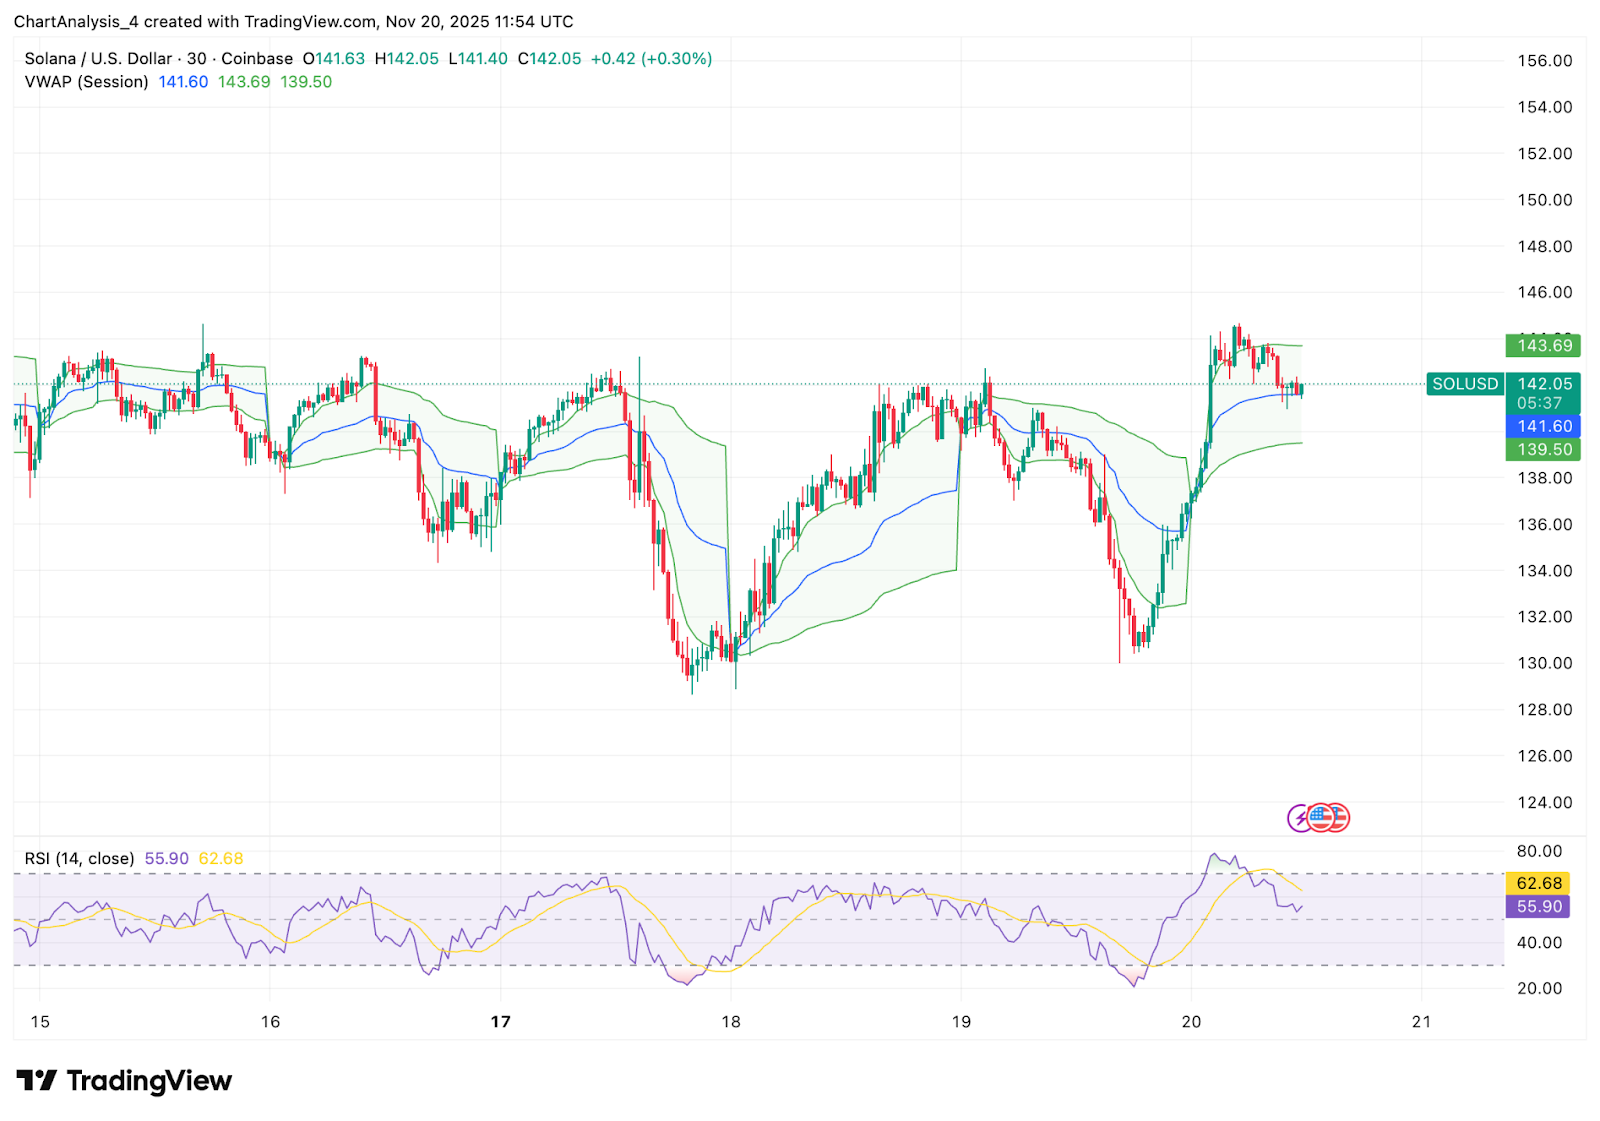
Shorter timeframe charts show early signs of stabilization. Solana trades above session VWAP near $141.60, with the upper VWAP band near $143.69 acting as intraday resistance. Price has struggled to clear this band, signaling hesitation from buyers despite the recovery attempt.
RSI currently sits near 55.90, recovering from earlier oversold levels. A push above 62 would strengthen bullish intraday structure, but the larger trend remains constrained by the breakdown on the daily chart.
Intraday volatility has tightened, and traders appear to be waiting for a catalyst before taking new directional positions.
Outlook. Will Solana Go Up?
The next move depends on how Solana behaves at the $133 to $138 support band. This area has repeatedly acted as a turning point, but trendline breaks and heavy outflows raise the risk of a more extended correction.
- Bullish case: A bounce above $153.56 would reclaim the 20 day EMA and signal a shift in short term momentum. Clearing $173.45 confirms strength and opens a path toward $200.
- Bearish case: A daily close below $133 exposes the next liquidity zone near $122, followed by deeper support around $108.
Related: XRP Price Prediction: XRP Weakens as Outflows Build and OI Falls Ahead of Bitwise ETF
Disclaimer: The information presented in this article is for informational and educational purposes only. The article does not constitute financial advice or advice of any kind. Coin Edition is not responsible for any losses incurred as a result of the utilization of content, products, or services mentioned. Readers are advised to exercise caution before taking any action related to the company.


 Price Prediction: XRP Stuck in Tight Range as Traders Watch $1.40 Support")