 Price Prediction: Breakout Or Pullback Next?")
Solana price today is trading near $202, extending a steady rebound after testing the $195 support zone earlier this week. The recovery has come amid rising spot inflows and renewed optimism around a potential golden cross on the SOL/BTC pair, a technical setup that previously triggered major rallies.
The move higher highlights a constructive start to September, with buyers defending key exponential moving averages and positioning for a potential retest of the $217 resistance area. Traders are closely watching whether SOL can maintain momentum and confirm a breakout from its tightening range.
Solana Price Holds Firm As Ascending Channel Guides Trend
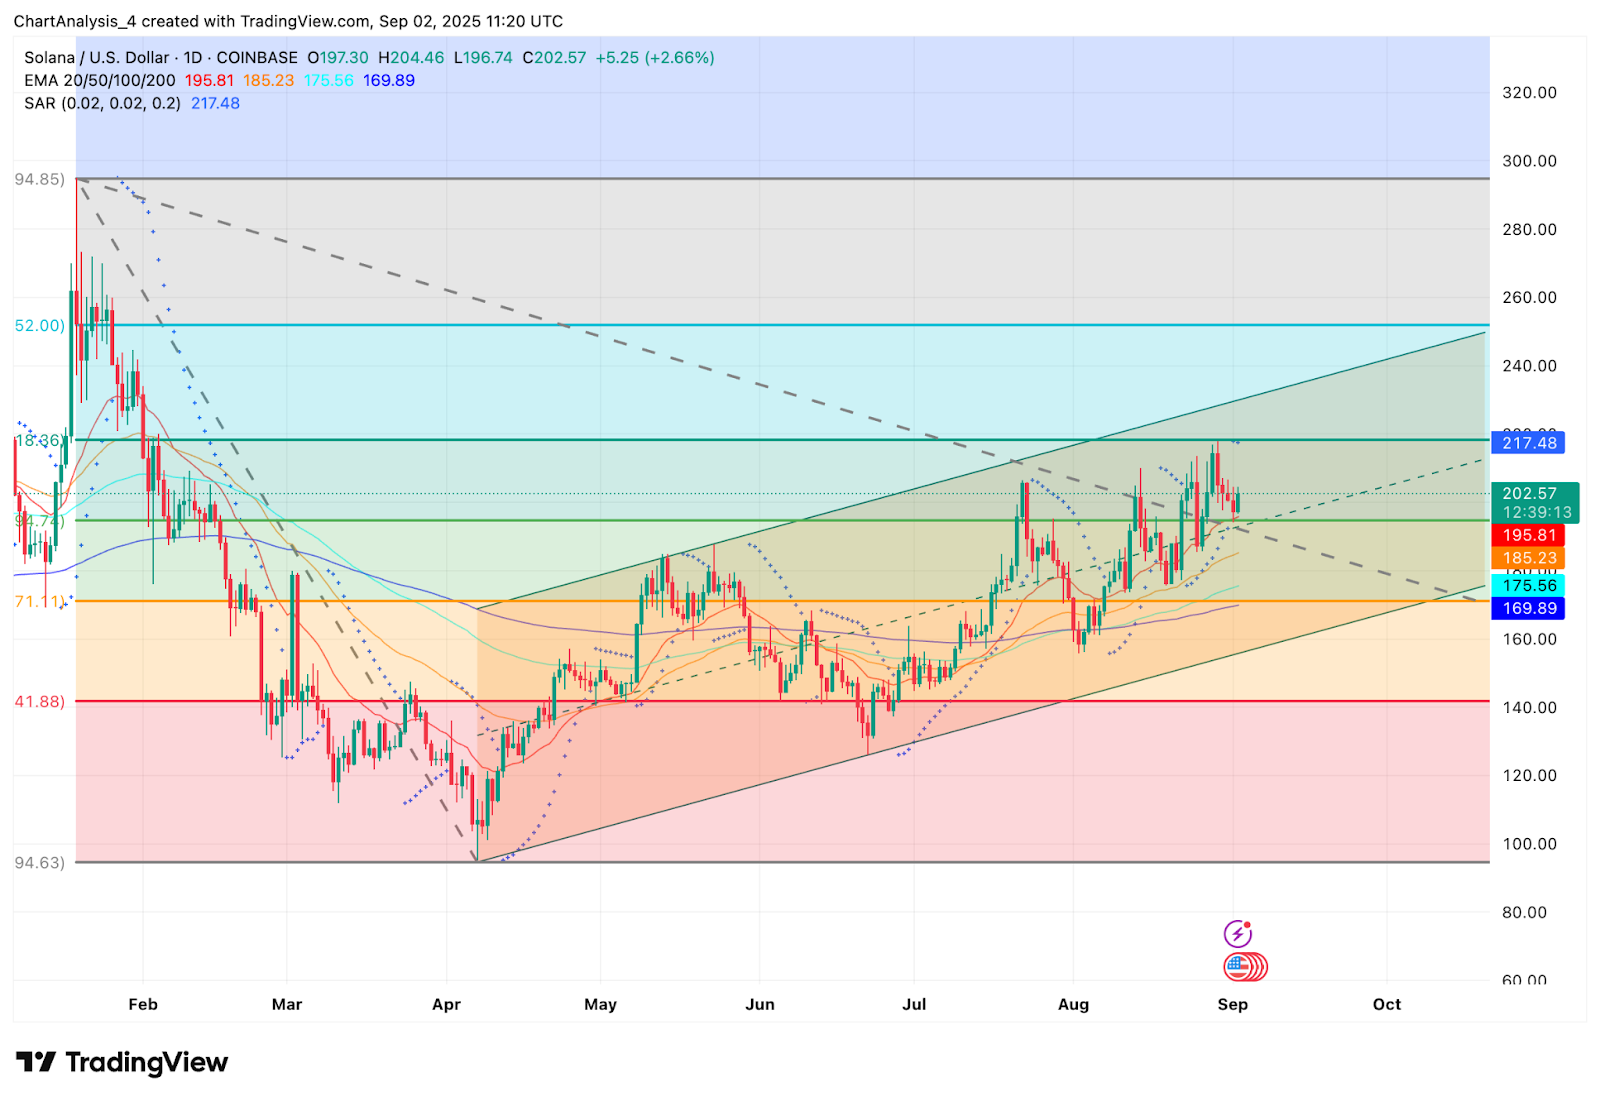
On the daily chart, Solana price action continues to respect an ascending channel that has been in place since May. Immediate support sits at $195, reinforced by the 20-day EMA, while deeper cushions are stacked at $185 and $175, aligning with the 50- and 100-day EMAs. The 200-day EMA at $169 remains the longer-term safety net.
Resistance at $217 has repeatedly capped upside attempts in August, making it the key near-term pivot. A clean break above this level would open the path toward $230 and the upper channel boundary closer to $240.
Momentum indicators suggest neutral-to-positive conditions. The parabolic SAR dots flipped beneath price at $196, signaling trend support, while RSI remains in mid-range territory, leaving room for additional upside without flashing overbought signals.
Related: Cardano (ADA) Price Prediction and Analysis for September 3
Golden Cross Setup And Whale Inflows Drive Sentiment
Beyond the technicals, momentum has been reinforced by strong market signals. Analyst Onur noted on X that SOL/BTC is lining up a golden cross, where the 50-day SMA crosses above the 200-day SMA. Historically, this setup preceded 1,000%+ rallies in 2021 and a 340% rally in 2023.
Onur suggested that with SOL holding above EMAs and treasury demand adding billions, the token could revisit $300 levels.
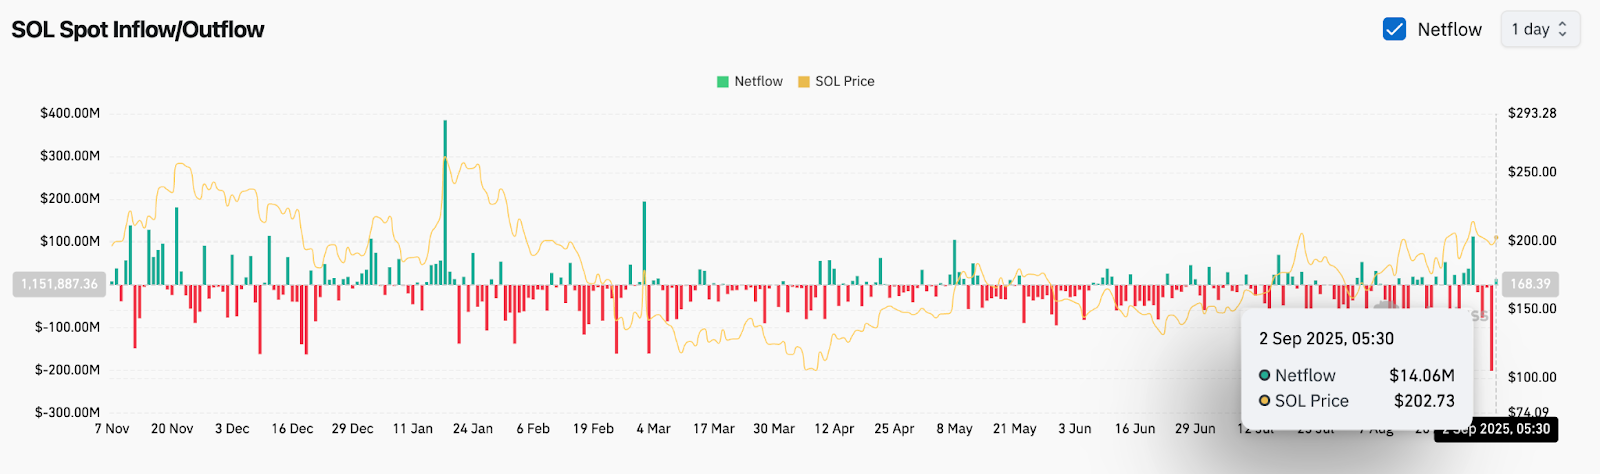
On-chain flows provide additional support. Coinglass data shows $14.06 million in net inflows on September 2, the largest positive print in weeks, signaling accumulation by larger holders. Sustained inflows above $200 suggest whales are positioning ahead of a potential breakout.
This combination of golden cross optimism and fresh inflows has heightened interest in Solana as a frontrunner for the next altseason rotation.
Related: Ethereum (ETH) Price Prediction for September 3
Contrasting Views: Bulls Eye Breakout, Bears Warn Of Rejection
The bullish case rests on SOL’s ability to reclaim $217 and extend higher within its channel. Defending the $195–$200 support cluster gives buyers the base to target $230 and possibly $245 in the coming sessions. Analysts argue that as long as inflows remain positive and the golden cross narrative builds, Solana could reprice higher toward mid-range Fibonacci levels near $250.
Bears remain cautious, pointing to repeated failures at the $217 zone. With Bollinger Bands tightening on the daily timeframe, the market could be vulnerable to a rejection that pulls SOL back toward $185 or even $175. If broader risk sentiment deteriorates, a deeper slide toward $169 cannot be ruled out.
This divergence leaves Solana balanced between bullish breakout potential and the risk of near-term profit-taking.
Solana Short-Term Outlook: Breakout Or Pullback Next?
Heading into September 3, the Solana price prediction hinges on the $217 resistance. A decisive close above this threshold would shift momentum firmly in favor of bulls, opening room toward $230–$240. Failure to do so could keep SOL pinned in the $195–$205 consolidation range, with downside risks toward $185 if inflows ease.
For now, the constructive backdrop of whale accumulation, golden cross anticipation, and supportive technicals keeps the bias slightly tilted to the upside. However, traders should watch $217 as the key pivot that will define Solana’s next leg.
Related: XRP (XRP) Price Prediction: Breakout or Breakdown Ahead?
Sol Price Forecast Table
| Indicator | Signal | Levels/Notes |
| Price Today | $202 | Holding above $200 support |
| Support | $195 / $185 / $175 | EMA cluster and channel base |
| Resistance | $217 / $230 / $240 | Breakout levels and channel top |
| RSI | Neutral | Room for upside, not overbought |
| MACD | Slightly positive | Momentum tilting upward |
| Pattern | Ascending channel | Range tightening near resistance |
| Flows | +$14.06M inflow | Whales accumulating above $200 |
| Supertrend | Bullish above $196 | Bias remains constructive |
Disclaimer: The information presented in this article is for informational and educational purposes only. The article does not constitute financial advice or advice of any kind. Coin Edition is not responsible for any losses incurred as a result of the utilization of content, products, or services mentioned. Readers are advised to exercise caution before taking any action related to the company.

 Price Prediction for April 2026: Will Chainlink Move Higher?")
 Price Prediction: Can Bulls Sustain the $0.045 Push?")

