 Price Prediction for July 11")
Solana price today is trading at $158.60 after a clean breakout from a long-standing symmetrical triangle. This structure, visible on the daily chart since March, has now resolved to the upside. However, derivatives sentiment and elevated put positioning suggest that while the technical setup is bullish, caution remains warranted as traders price in macro uncertainty following the FOMC tone shift.
What’s Happening With Solana’s Price?
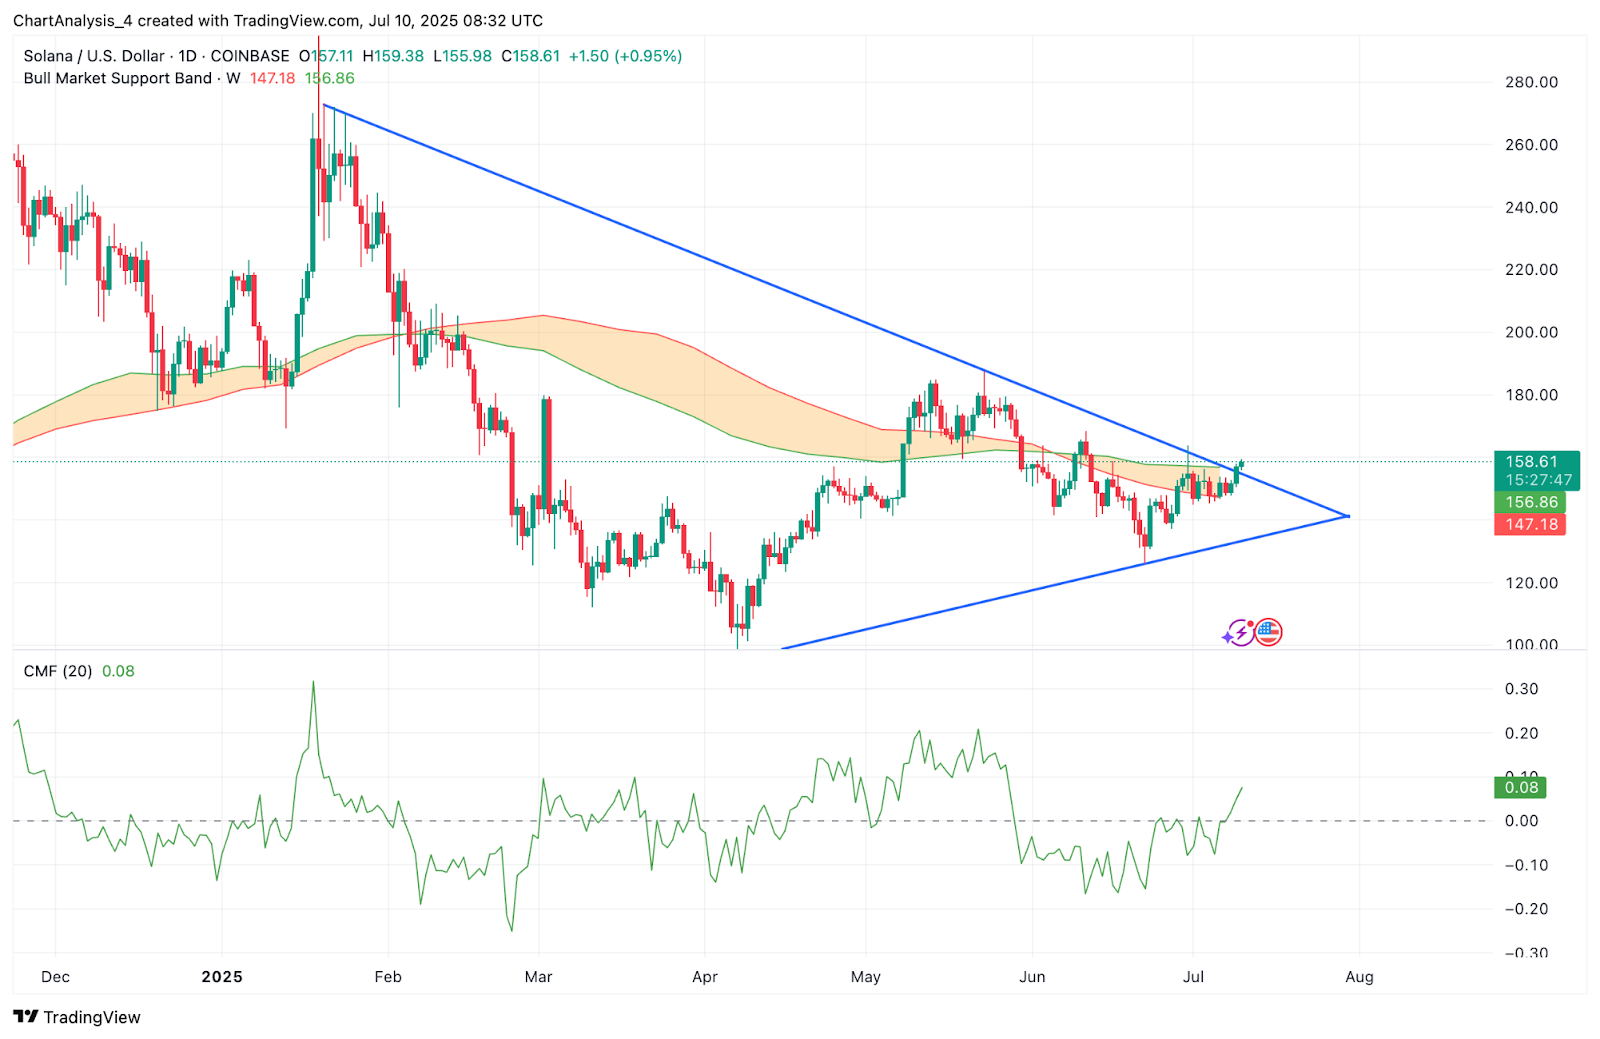
The daily chart confirms that Solana price has broken above the triangle apex around $156, flipping both the Bull Market Support Band and dynamic EMAs into support. Price is now pushing against the $158–$160 resistance zone, with short-term momentum favoring a continuation toward $164 if bulls hold.
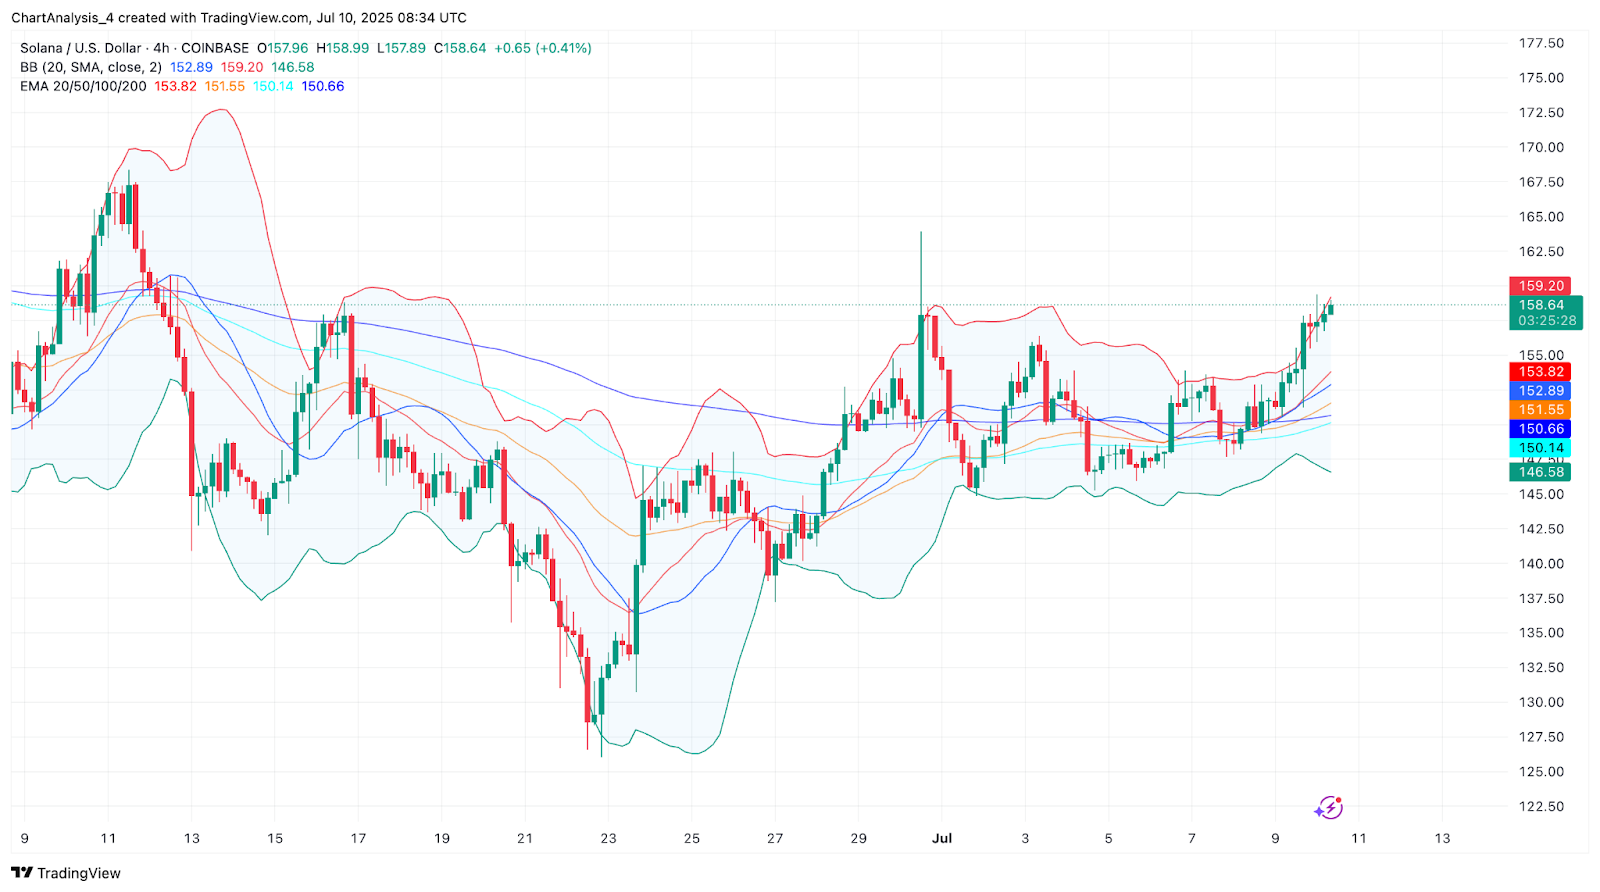
On the 4-hour chart, SOL has surged above the Bollinger Band midline and is now testing the upper band at $159.20. All EMAs (20/50/100/200) are stacked in bullish alignment, reinforcing the current uptrend. The Supertrend indicator has also flipped green on the 4H timeframe at $150.75, supporting a bullish intraday bias.
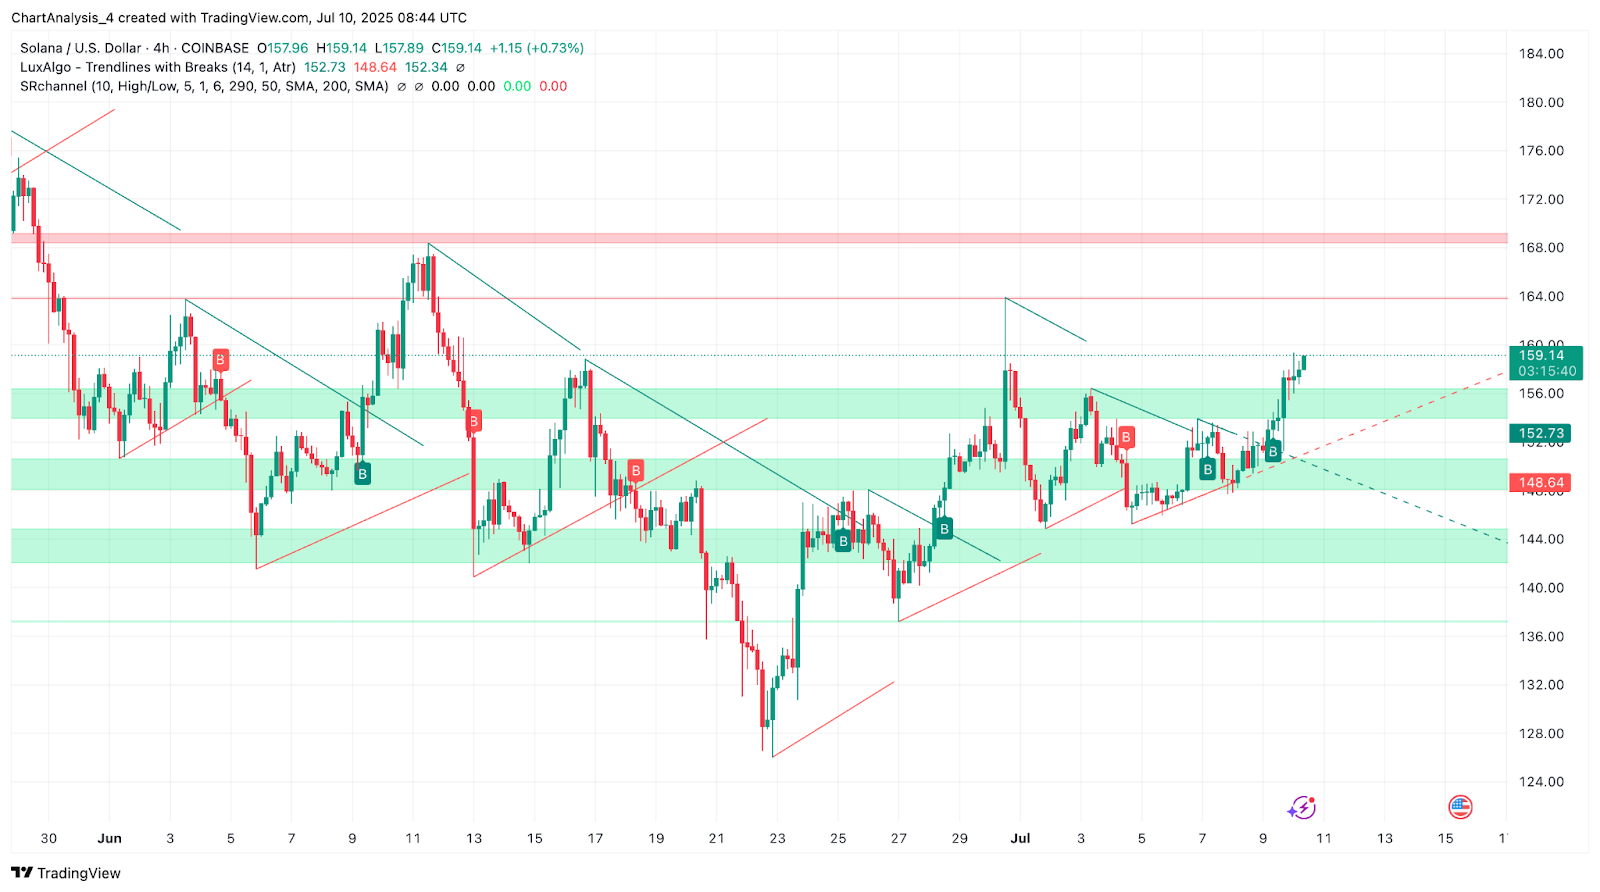
The trendlines confirm this breakout, with price moving beyond the resistance at $152.73 and no bearish breaks showing up across major trend channels. This structural push sets the stage for testing higher liquidity zones between $162 and $168.
Why Is The Solana Price Going Up Today?
Why Solana price going up today is tied to the triangle breakout and strong EMA support. However, not all sentiment is bullish.
The derivatives market is showing signs of hedging despite the rally. Between July 7 and July 9, the SOL call/put ratio shifted from 0.35 to 1.19, meaning more traders are now betting on downside protection. Put premiums have risen significantly, reflecting cautious sentiment amid growing uncertainty around the Federal Reserve’s rate outlook. FOMC meeting minutes triggered speculation about potential cuts, and this macro backdrop appears to be influencing traders’ option strategies.
Still, long-biased data remains visible:
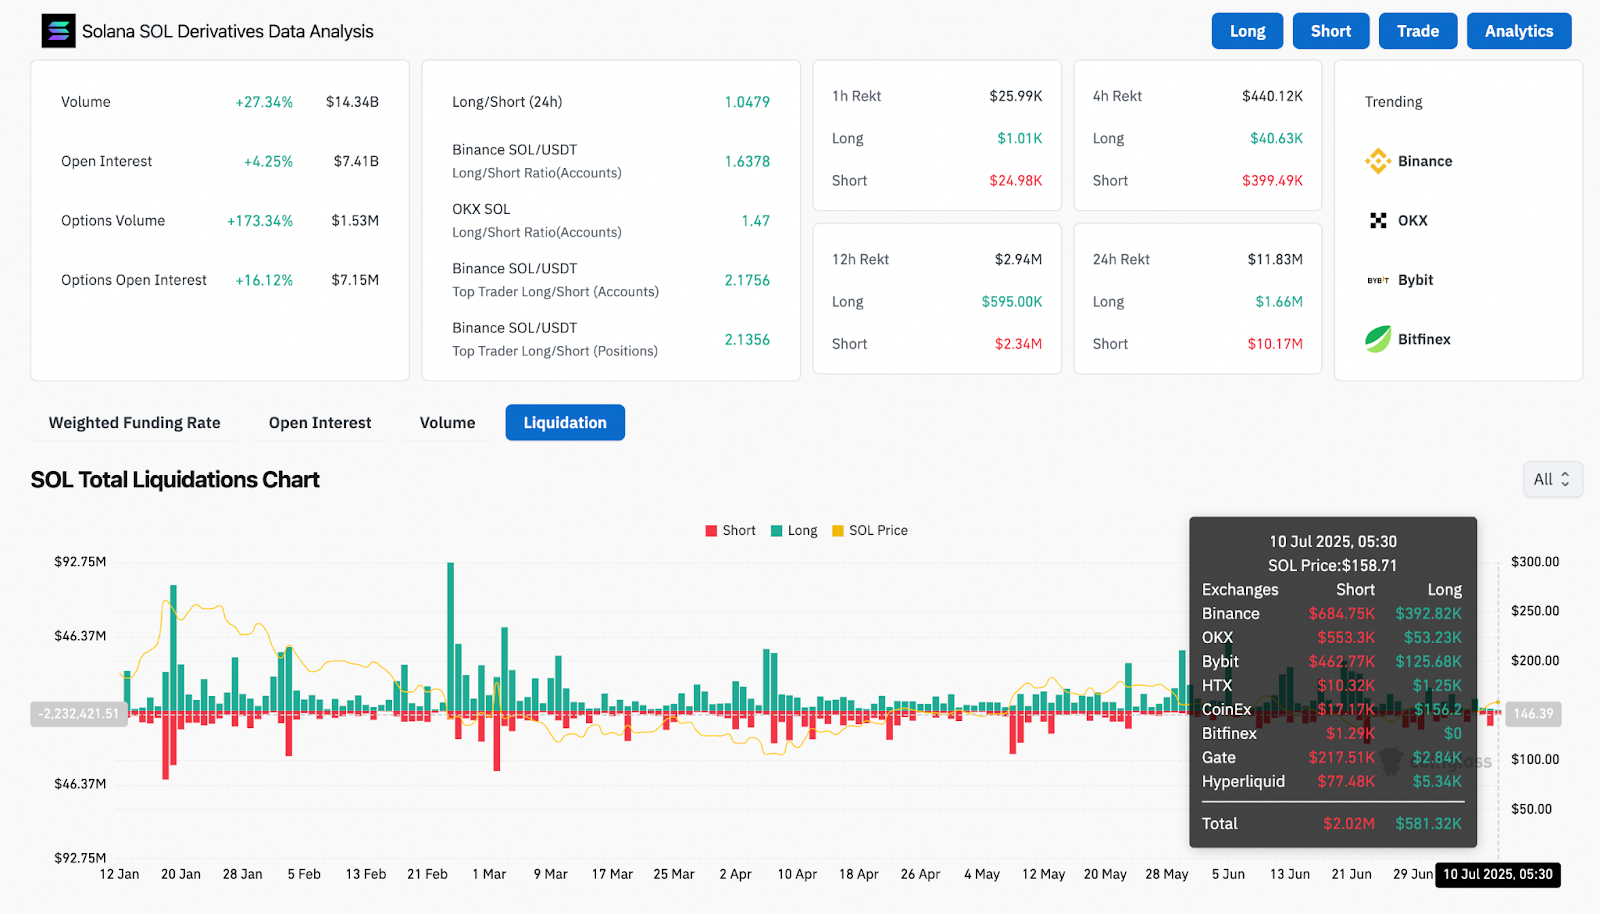
- SOL derivatives volume rose 27.34% to $14.34B.
- Open interest climbed 4.25% to $7.41B.
- Options volume surged +173.34%, and options open interest gained 16.12%.
- Binance top trader long/short ratio (positions) stands at 2.1356, with OKX accounts near 1.47, indicating bulls remain active.
While price pushes higher, the market is cautiously positioned. Liquidations data shows shorts losing over $2M in the last session, suggesting the breakout caught bears off guard.
RSI, MACD, and DMI Highlight Momentum Shift
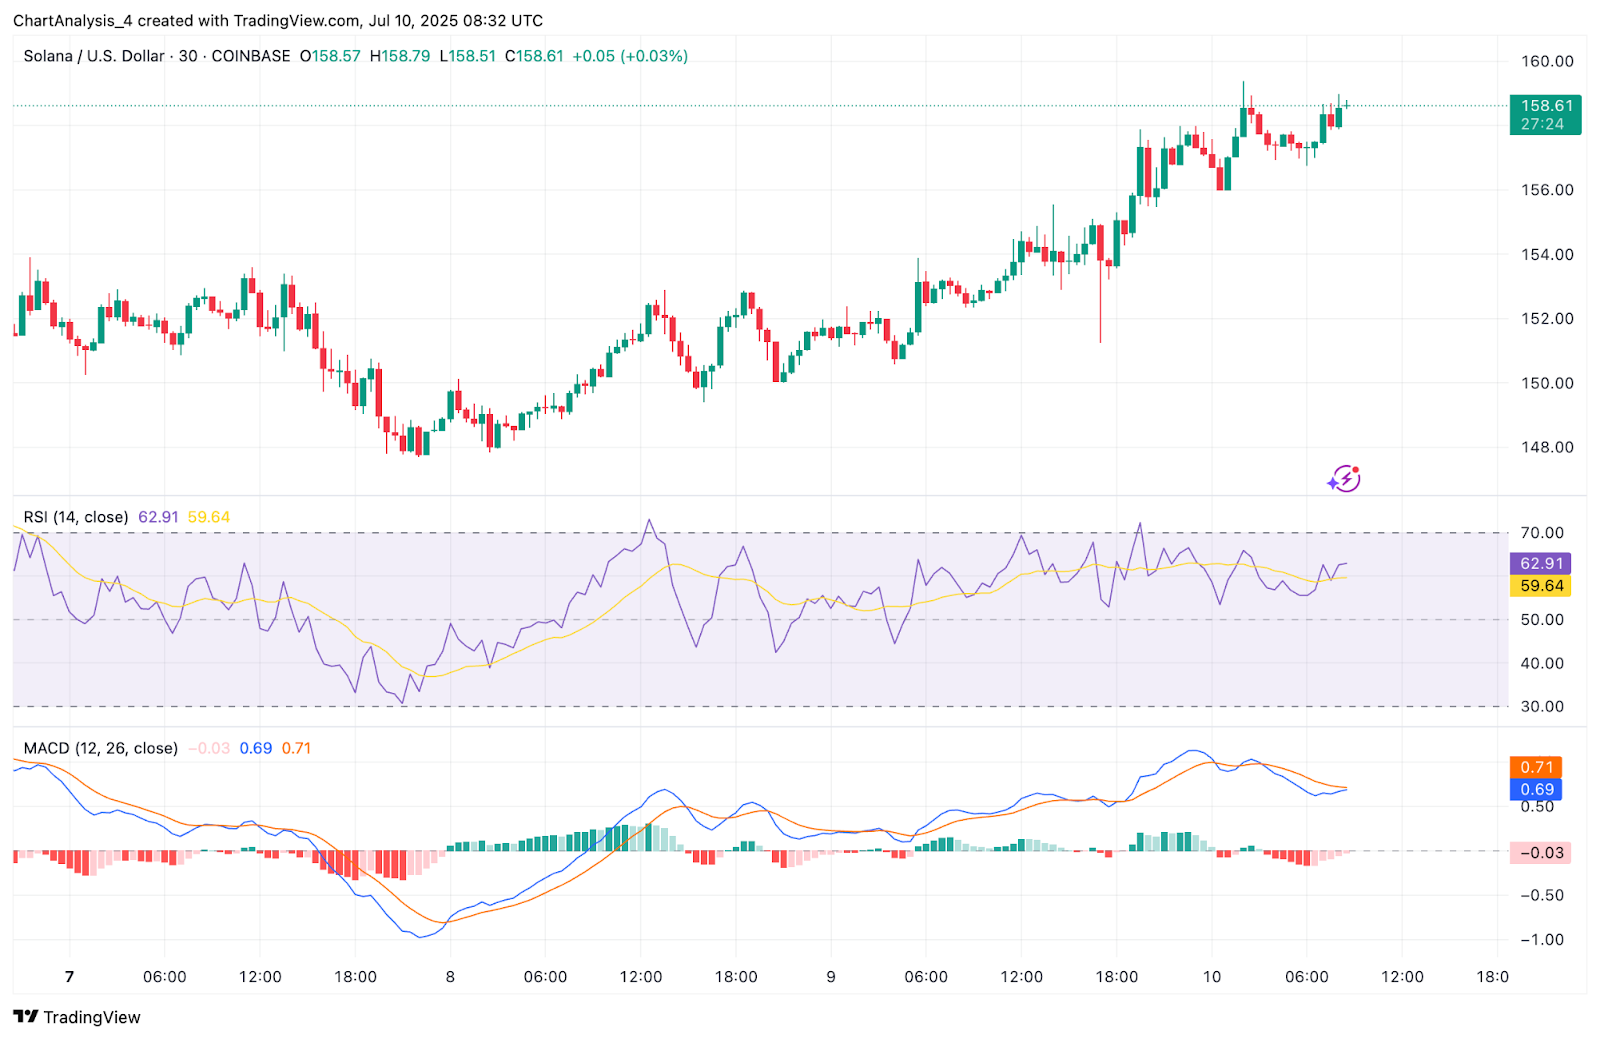
On the 30-minute chart, RSI reads 62.91, holding in bullish territory. This aligns with MACD, which shows a positive crossover with expanding histogram bars, suggesting underlying support for the move.
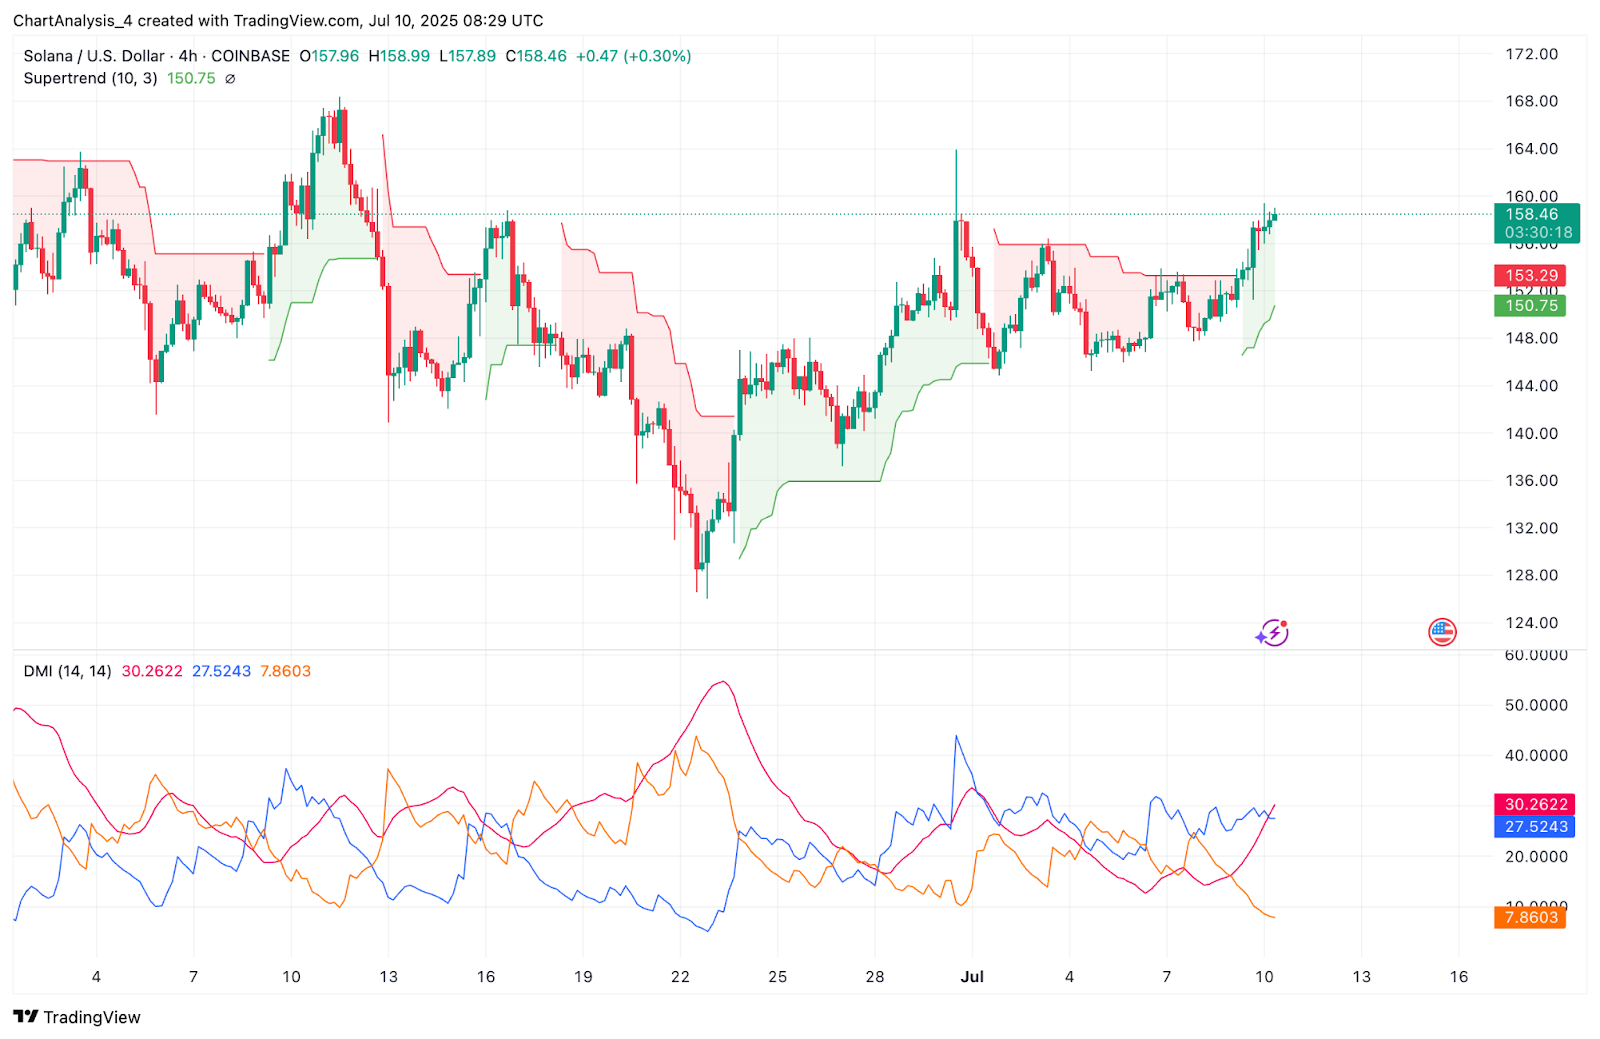
The DMI indicator on the 4H chart confirms directional expansion, with +DI (30.26) slightly above −DI (27.52) and ADX rising above 25. This structure reflects a recovering trend after weeks of sideways action, validating the bullish bias.
The CMF (Chaikin Money Flow) on the daily timeframe is also positive at 0.08, indicating capital inflows and healthy accumulation during the breakout.
SOL Price Prediction: Short-Term Outlook (24H)
If Solana price clears the $160–$162 range with volume, the next leg higher could target $168 and then $175. These levels mark prior supply zones visible in May and coincide with options OI clusters and weekly inefficiencies.
On the downside, immediate support sits at $152.73 and then $148.64, both zones marked by strong trendline confluence and LuxAlgo order block alignment. Below that, $146.50 (lower Bollinger Band) would act as deeper support.
Given rising put activity and FOMC-induced caution, short-term volatility may spike around the $160 handle. Traders should monitor volume and derivatives ratios for signs of a breakout continuation or exhaustion pullback.
Solana Price Forecast Table: July 11, 2025
| Indicator/Zone | Level / Signal |
| Solana price today | $158.60 |
| Resistance 1 | $160.00 (Psychological resistance) |
| Resistance 2 | $168.00 (Prior supply zone) |
| Support 1 | $152.73 (Trendline and structure base) |
| Support 2 | $148.64 (Order block zone) |
| RSI (30-min) | 62.91 (Bullish) |
| MACD (30-min) | Bullish Crossover, expanding histogram |
| DMI (4H) | +DI leads, ADX > 25 |
| Bollinger Bands (4H) | Price near upper band ($159.20) |
| Supertrend (4H) | Flipped bullish at $150.75 |
| CMF (Daily) | +0.08 (Accumulation signal) |
| Call/Put Ratio (7–9 July) | Jumped from 0.35 to 1.19 |
| Binance Long/Short Ratio | 2.1356 (Top traders long-biased) |
| Liquidations (Shorts, 24h) | $2.02M wiped in recent session |
Disclaimer: The information presented in this article is for informational and educational purposes only. The article does not constitute financial advice or advice of any kind. Coin Edition is not responsible for any losses incurred as a result of the utilization of content, products, or services mentioned. Readers are advised to exercise caution before taking any action related to the company.

 Price Prediction: Can Bulls Reclaim the 0.236 Level?")

 Price Prediction: Can Bulls Break the $329 Barrier?")
