 Price Prediction for July 15")
Solana price has pushed higher into mid-July, reaching $167.25 amid renewed bullish momentum. The surge comes as traders eye a breakout above the 0.382 Fibonacci retracement level, with Solana price today up over 3.5% in the past 24 hours. The technical structure suggests SOL may be preparing for a challenge of higher resistance near $175 and beyond.
Solana Price Forecast Table: July 15, 2025
| Indicator / Zone | Level / Signal |
| Solana price today | $167.25 |
| Resistance 1 | $175.55 (Fib 0.382) |
| Resistance 2 | $198.00 (Fib 0.5 / supply zone) |
| Resistance 3 | $222.24 (Fib 0.618) |
| Support 1 | $162.50 (BB mid-band / EMA20) |
| Support 2 | $158.47 (EMA50) |
| Support 3 | $154.90 (EMA100) |
| RSI (30-min / 4H) | 67.05 / 61.77 (bullish strength) |
| MACD (30-min) | Bullish crossover, positive histogram |
| Bollinger Bands (4H) | Expansion near upper band (volatile) |
| Supertrend (4H) | Bullish above $157.58 |
| VWAP (30-min) | Above session VWAP ($165.91) |
| DMI / ADX | +DI leads, ADX above 25 (trend strong) |
| Derivatives Open Interest | $8.19B (+1.90%), long-heavy bias |
| Trend Bias | Bullish above $162.50, aiming for $175.55+ |
What’s Happening With Solana’s Price?
Solana has continued its recovery trend from June lows near $125, printing a clean higher low and reclaiming the key $160–$162 supply zone. On the daily chart, the move has flipped a critical CHoCH level from mid-June and pushed above the 20/50/100 EMA cluster on the 4-hour chart, establishing a bullish base.
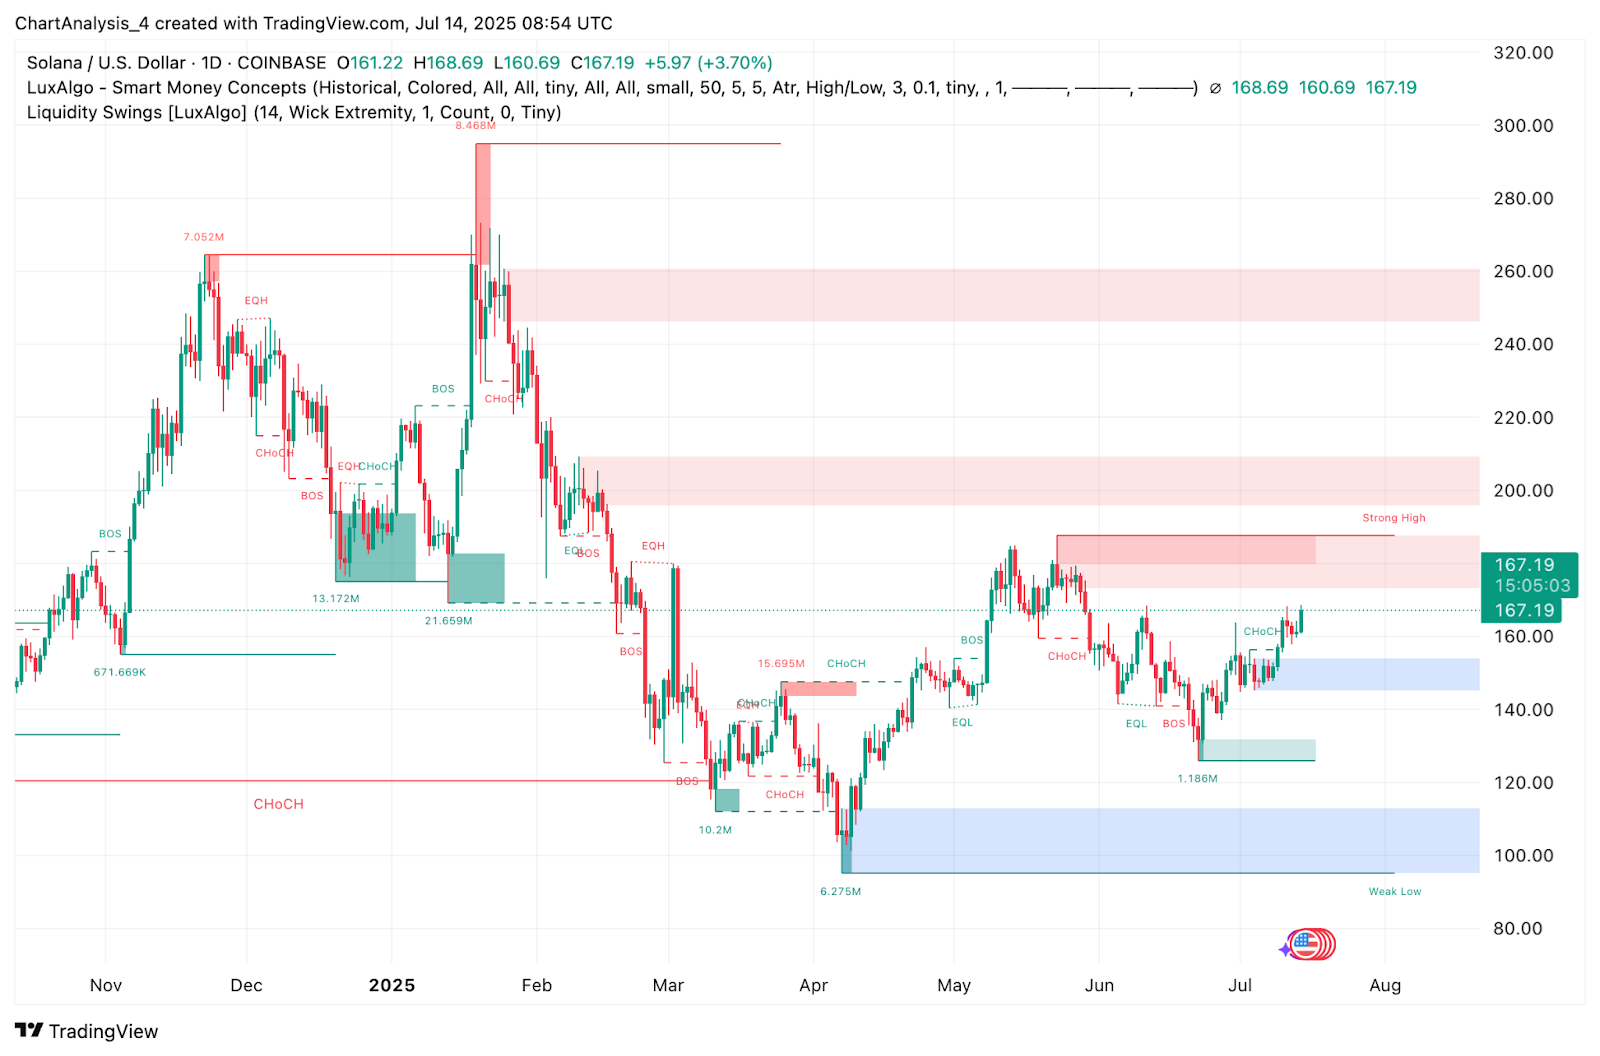
Smart Money Concepts data reveals multiple BOS signals and a structure reclaim around $160, which had acted as a ceiling for much of July. The current push into the $167 zone brings SOL closer to the 0.382 Fibonacci level at $175.55 — a key resistance zone that could dictate the next leg of price discovery.
The weekly chart also shows price climbing within a rising wedge toward the $198–$222 range (Fib 0.5–0.618), which remains the broader macro target should bullish momentum persist.
Why Solana Price Going Up Today?
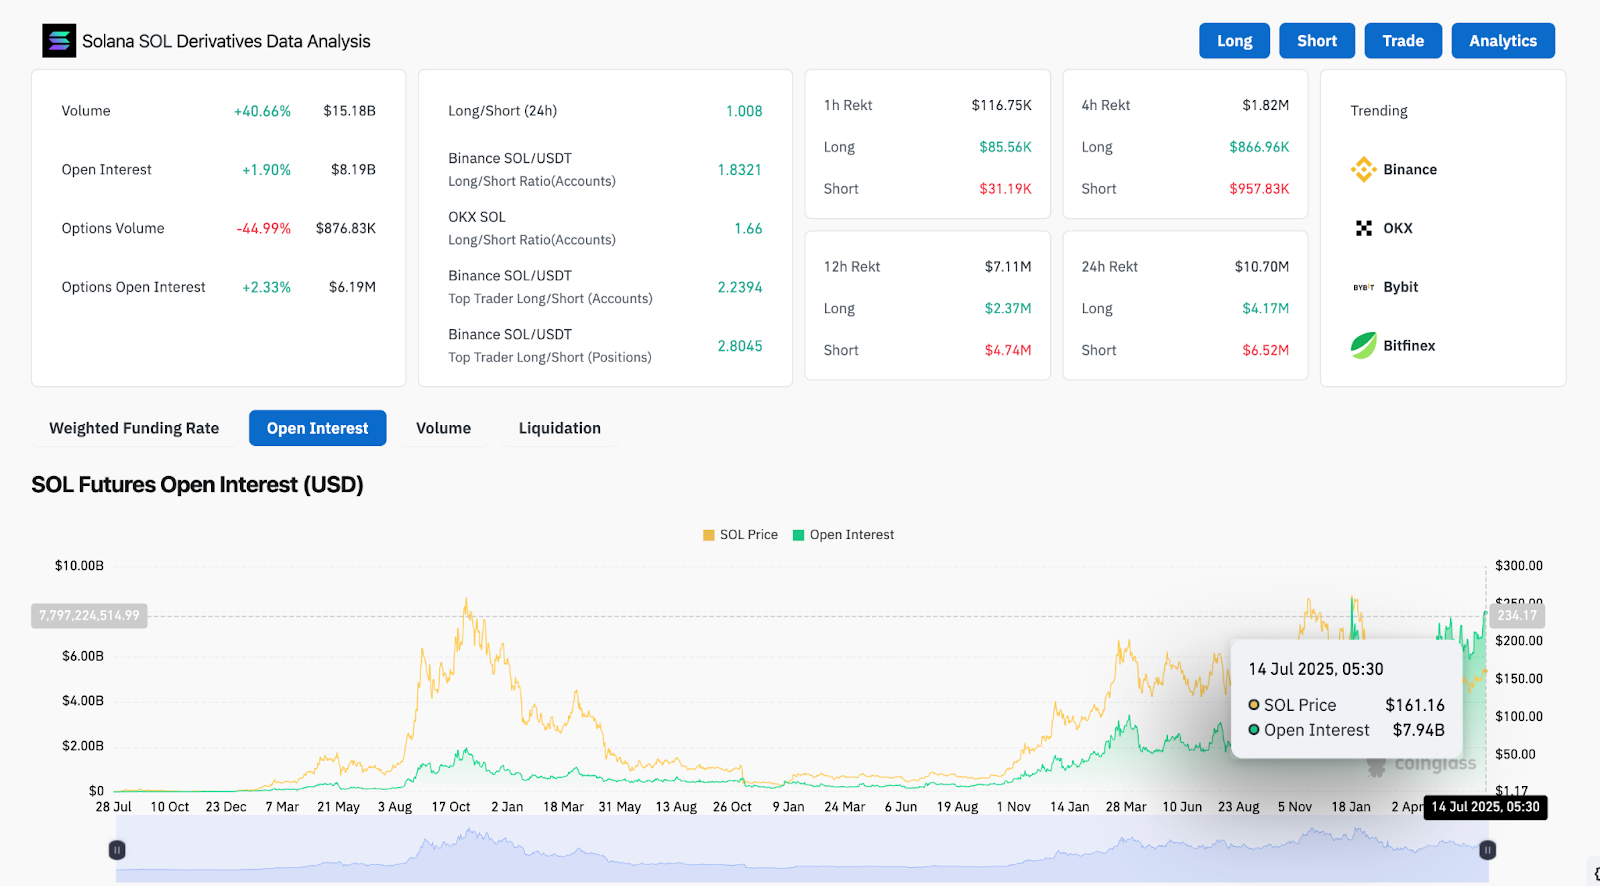
Why Solana price going up today can be attributed to strong intraday momentum and increasing bullish participation in derivatives markets. Open interest has climbed by 1.90% to $8.19 billion, while 24-hour volume is up over 40% to $15.1 billion, according to Coinglass. Binance’s long/short ratio shows a bias of 2.80 among top traders, suggesting a high-confidence long buildup.
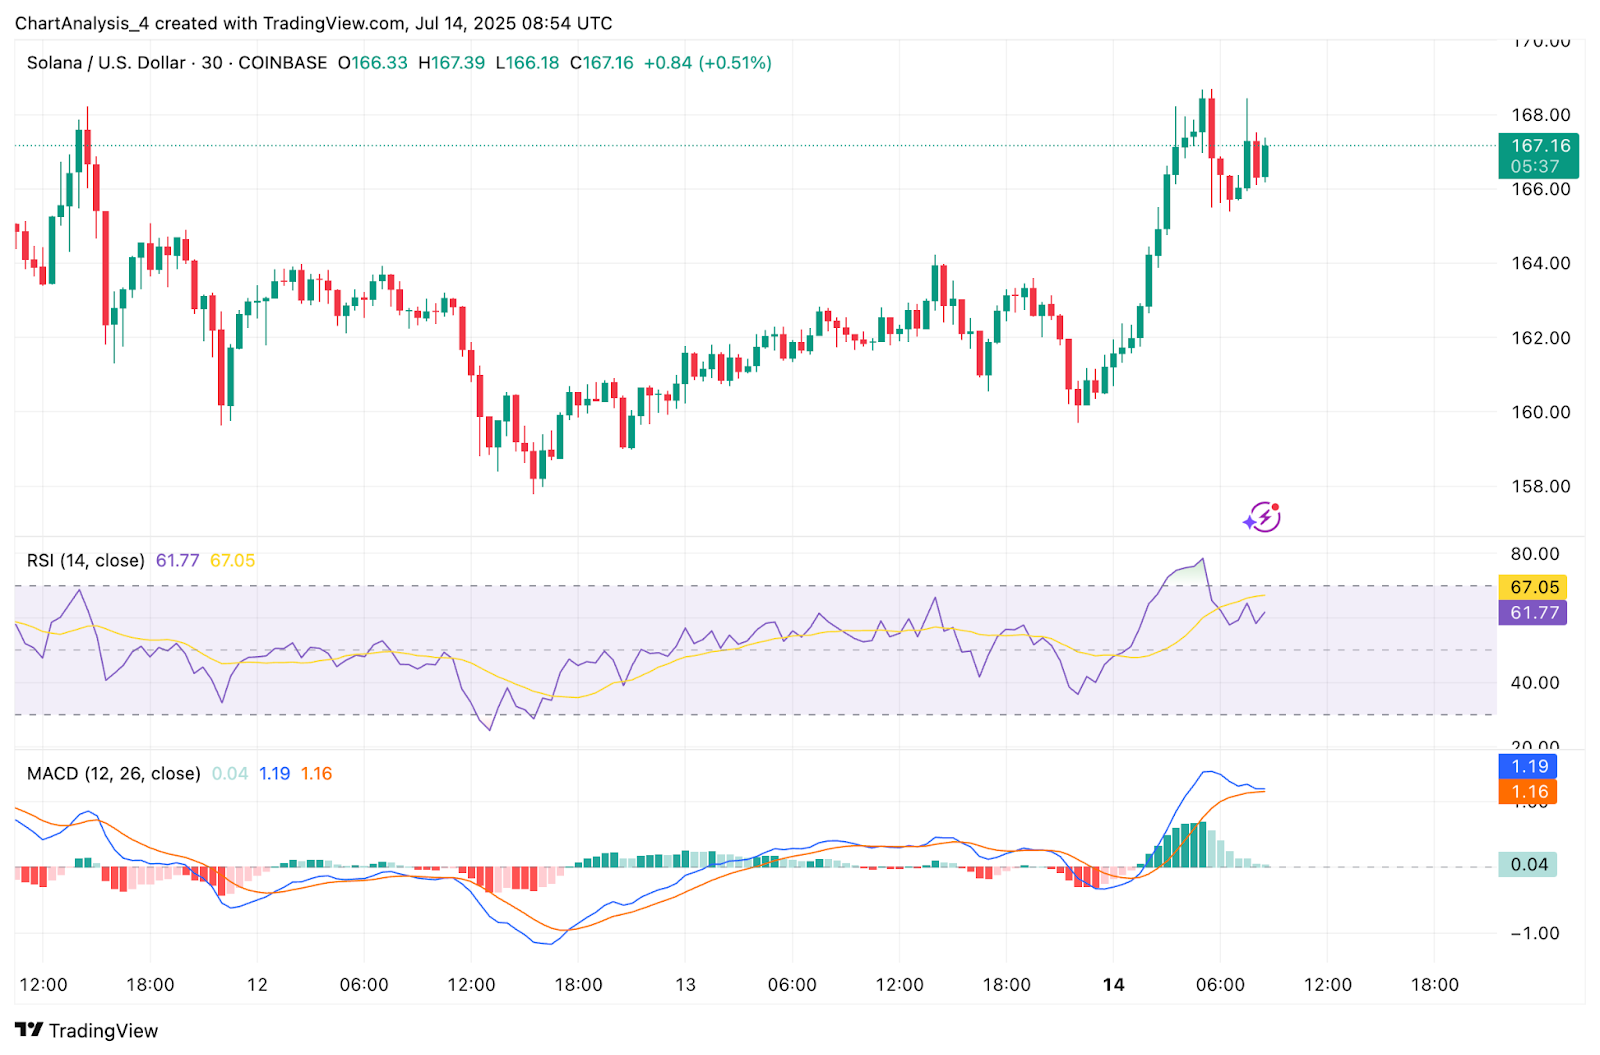
Momentum indicators are also aligned with the uptrend. On the 30-minute chart, RSI has moved above 67, while MACD remains in bullish territory, printing positive histogram bars.
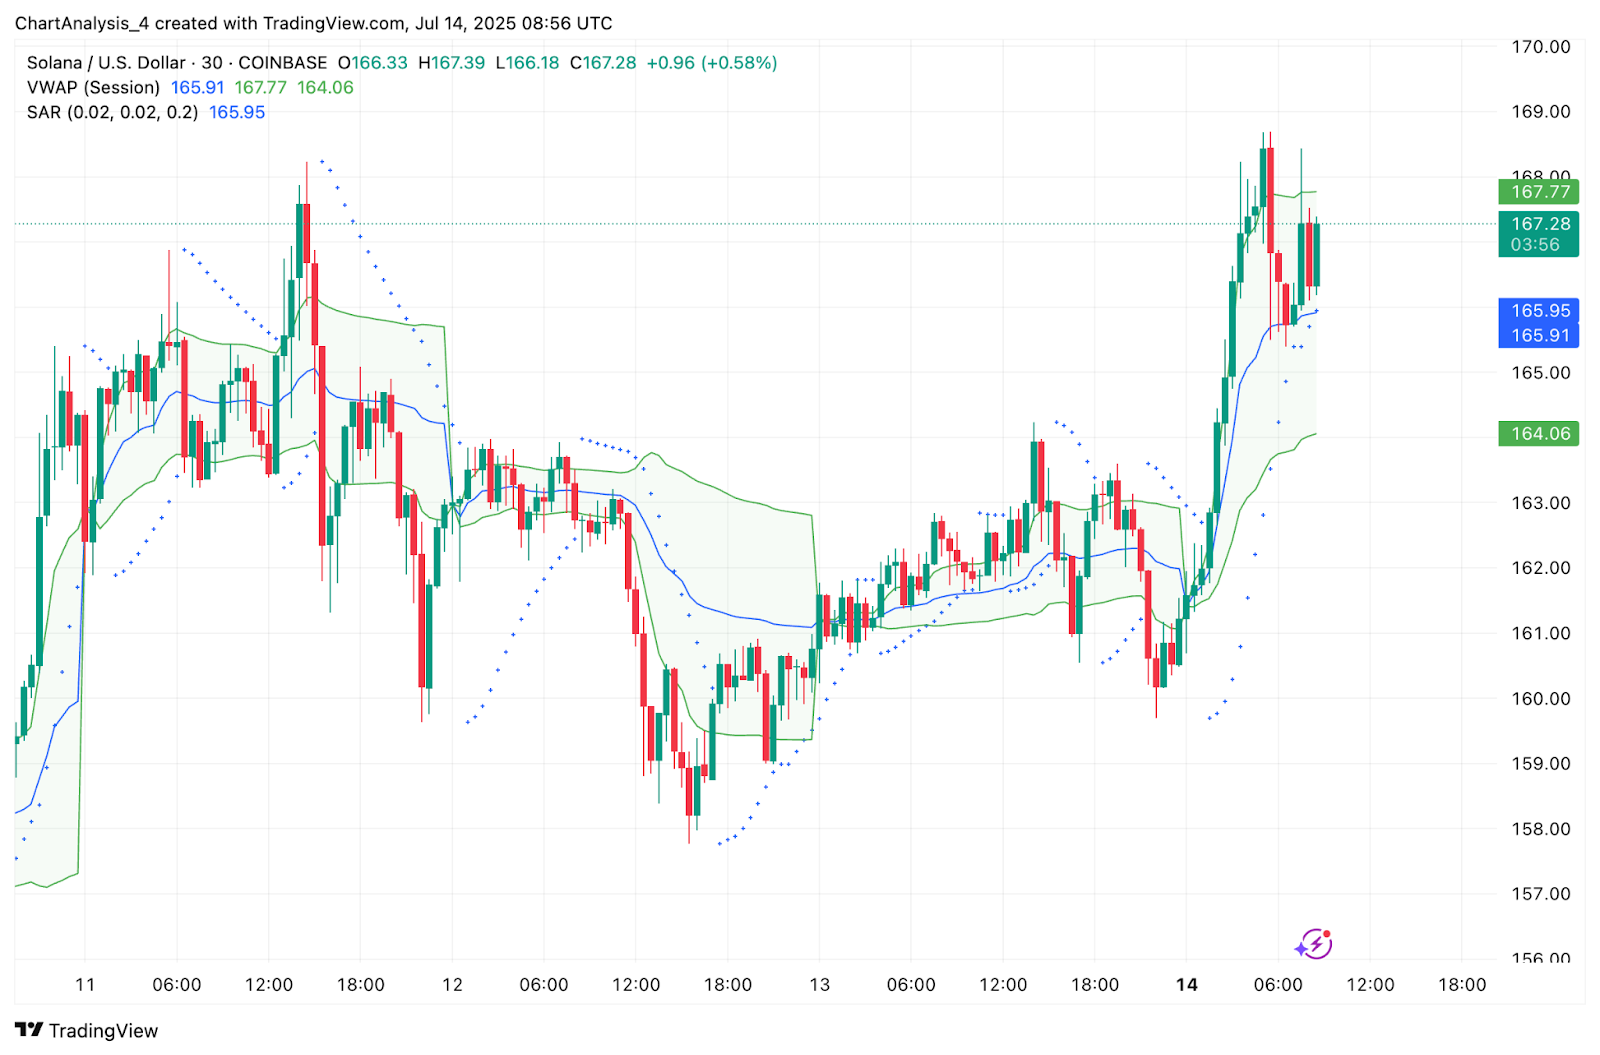
Price has reclaimed VWAP and is holding above the $165.90 mean, with Parabolic SAR dots now below the candle structure, confirming trend support.
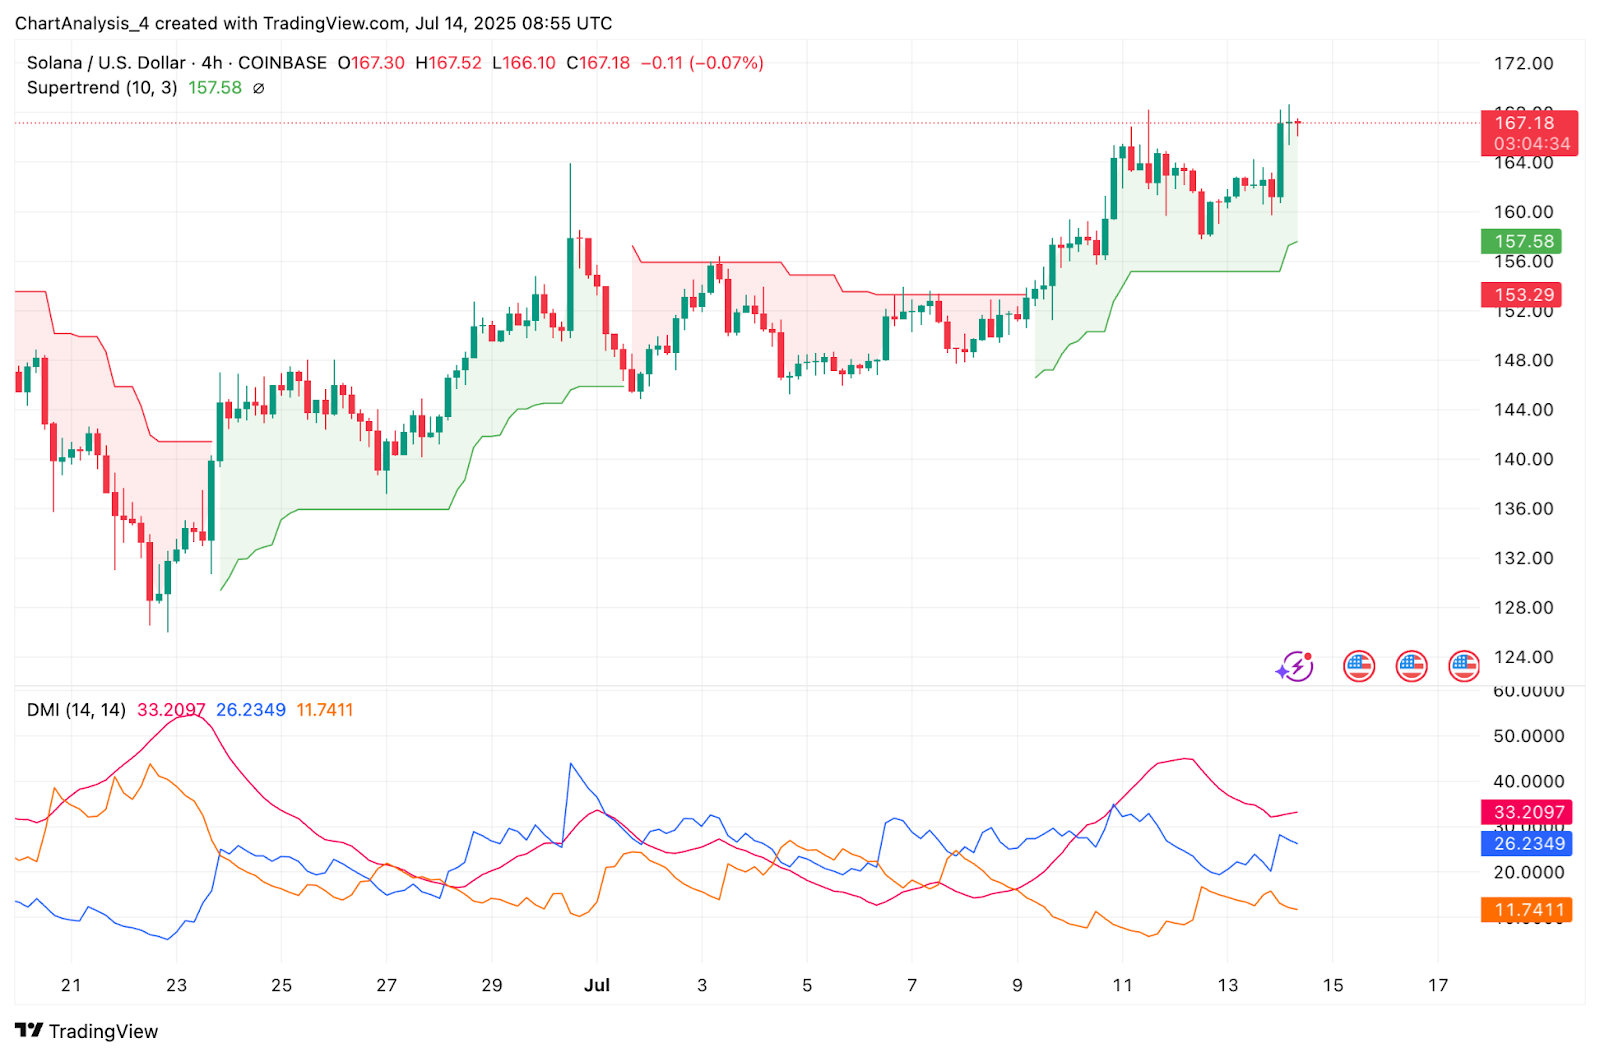
The Supertrend on the 4-hour chart flipped bullish at $157.58 and remains active. DMI confirms trend continuation with the +DI leading and ADX climbing above 25, showing that strength is backing this breakout attempt.
Solana Price Signals Prepare for Fib-Level Breakout
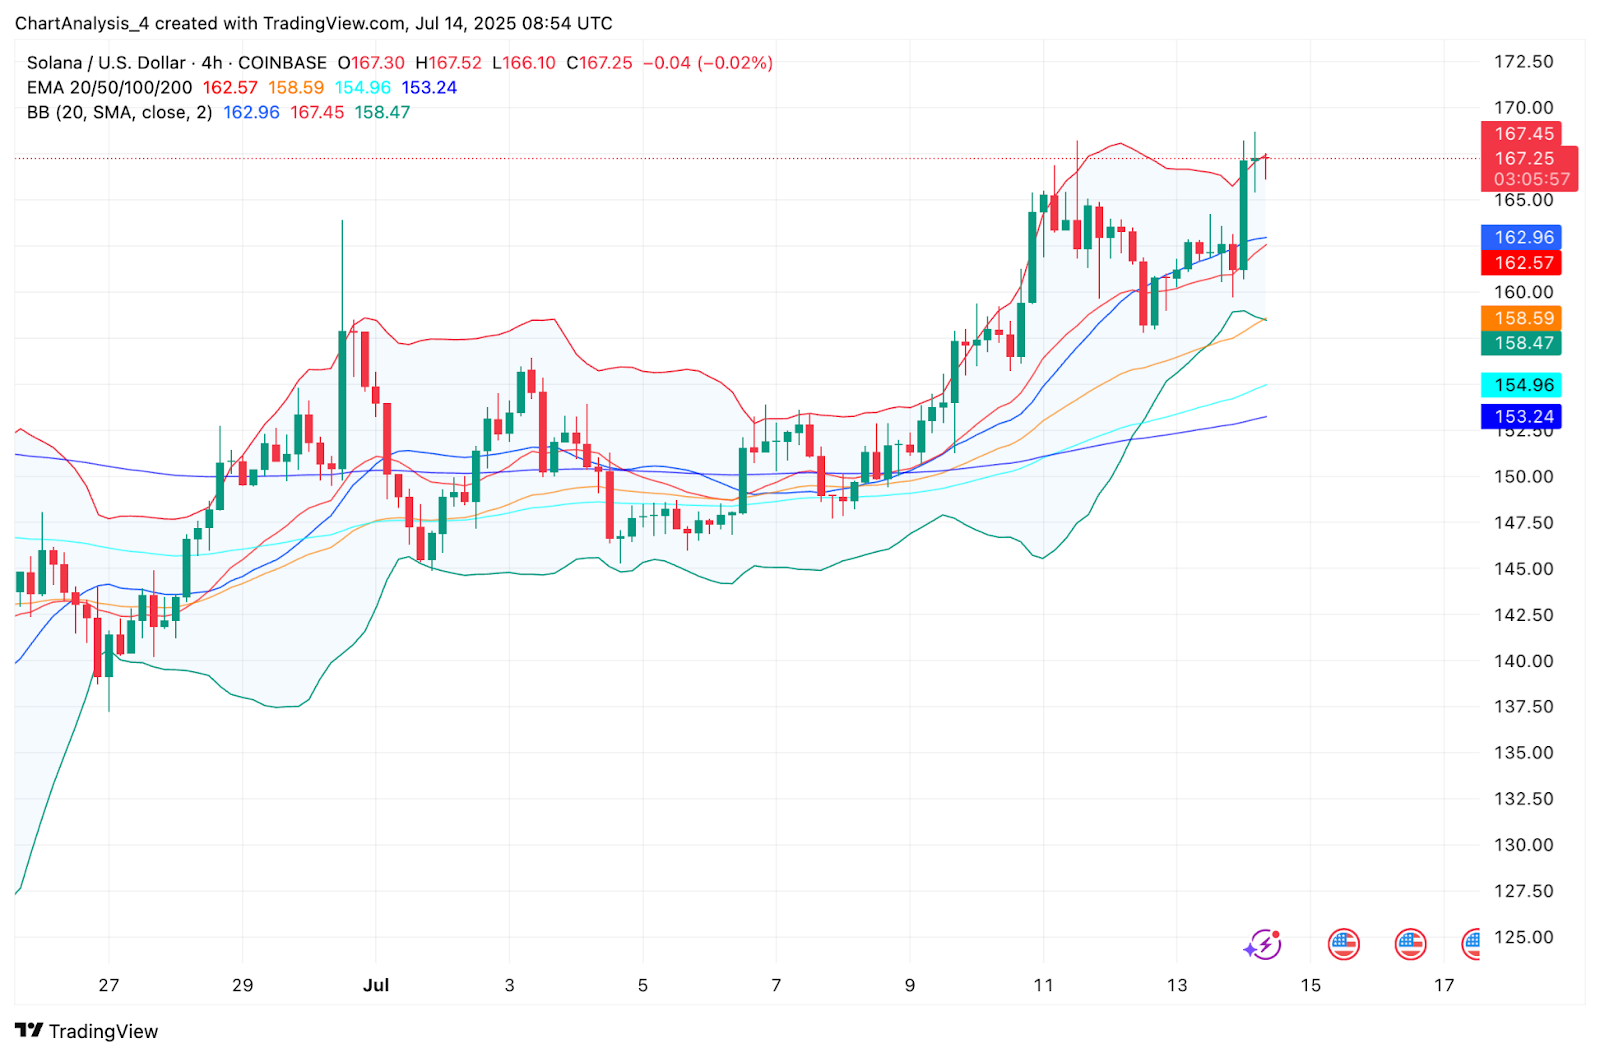
The 4-hour Bollinger Bands show a volatility expansion setup, with price pushing against the upper band at $167.45. This often precedes a directional continuation, especially when combined with EMA support just below at $158.47–$162.57. The alignment of these dynamic levels builds a strong case for further upside.
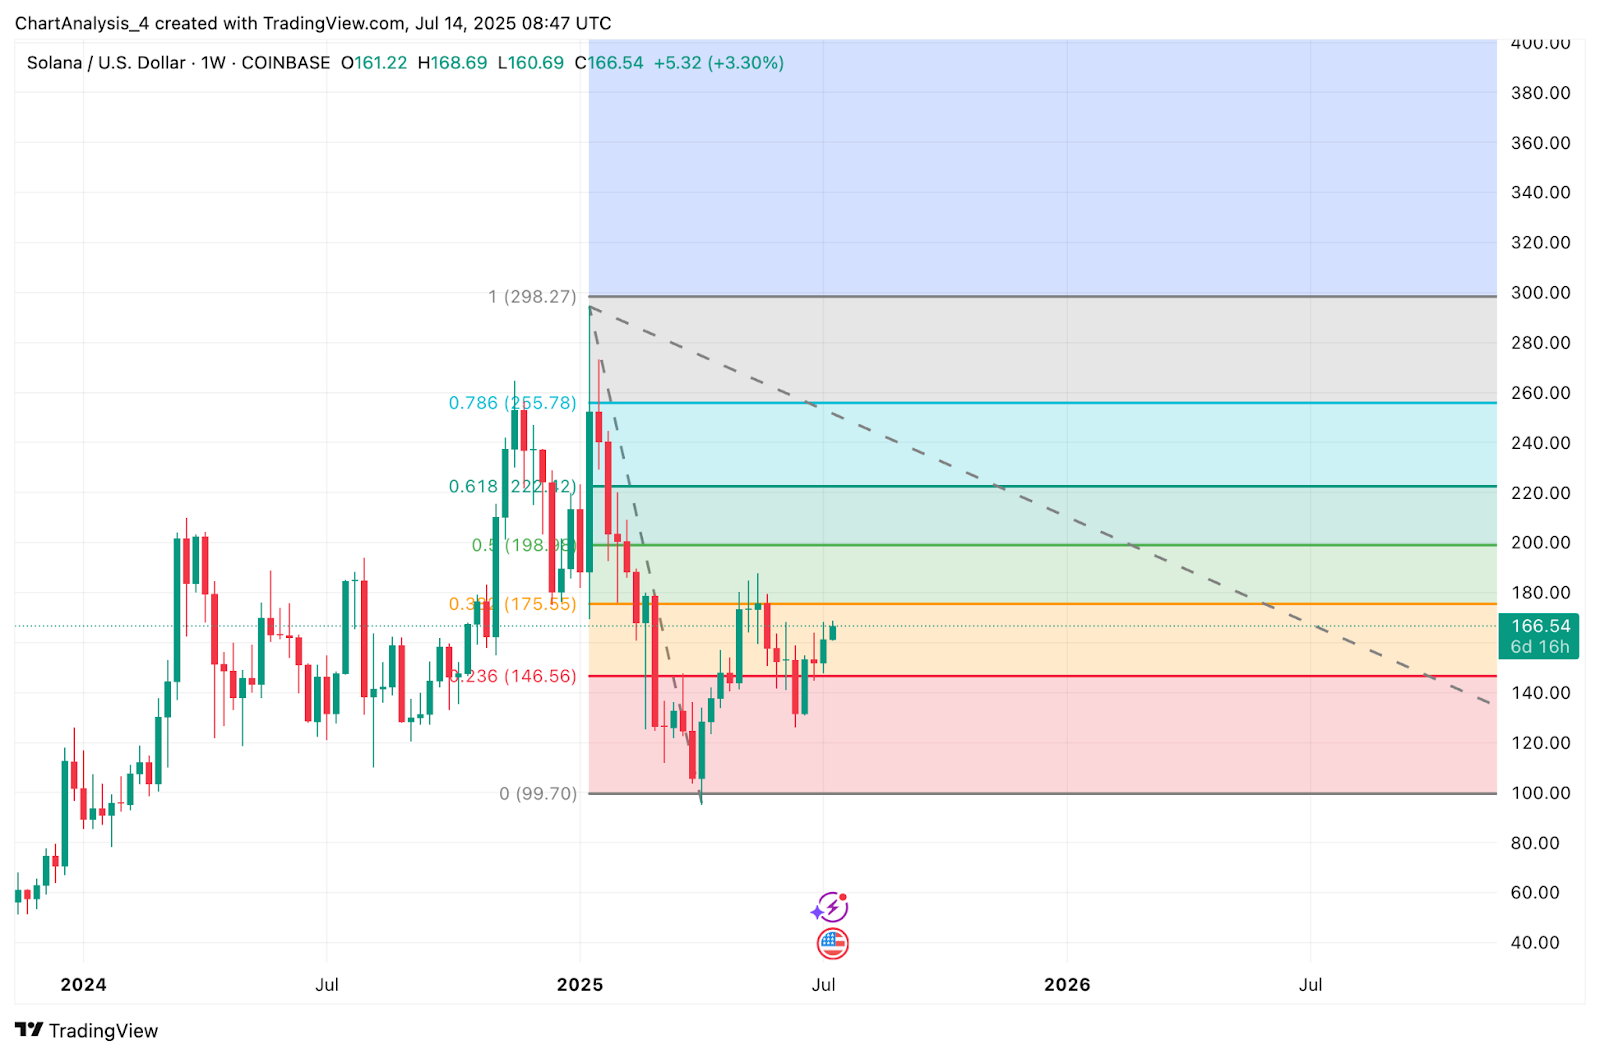
From a Fibonacci perspective, Solana price today sits between the 0.236 retracement at $146.56 and the 0.382 level at $175.55. A confirmed close above $175 could expose the $198 resistance (Fib 0.5), followed by the 0.618 mark at $222.24 — a zone that intersects with long-term descending trendline resistance from the late 2024 high.
If bulls fail to sustain above $167, however, a near-term retracement toward the $158–$162 support band could occur. Still, with open interest rising, momentum intact, and price structure flipping long, short-term risk remains skewed in favor of continuation.
SOL Price Prediction: Short-Term Outlook (24H)
Solana price now faces a pivotal test. A close above $168.50–$170 could spark follow-through toward $175.55 (Fib 0.382). If this level is broken with conviction, bulls may target $198 and $222. In contrast, a pullback below $162.50 could delay the breakout and send price toward $154.90–$158.50 support.
Given strong derivatives activity, supportive EMAs, and bullish RSI-MACD structure, the bias remains upward, but traders should watch for volume confirmation near $170.
Disclaimer: The information presented in this article is for informational and educational purposes only. The article does not constitute financial advice or advice of any kind. Coin Edition is not responsible for any losses incurred as a result of the utilization of content, products, or services mentioned. Readers are advised to exercise caution before taking any action related to the company.


