 Price Prediction for July 17")
The Solana price today is hovering around $163.66 after posting a resilient recovery over the past week. This follows the highly publicized on-chain Pump.fun ICO, which raised $600 million in just 12 minutes, a feat that has refocused attention on Solana’s scalability and user engagement. Despite minor intraday weakness, the technical structure remains cautiously bullish, with SOL pressing into the upper bounds of a tightening triangle.
Solana Price Forecast Table: July 17, 2025
| Indicator/Zone | Level / Signal |
| Solana price today | $163.66 |
| Resistance 1 | $167.30 |
| Resistance 2 | $178.00 |
| Support 1 | $162.00 |
| Support 2 | $156.00 |
| VWAP (30-min) | $163.45 (neutral zone) |
| EMA Cluster (4H) | $156–$162 (bullish stack) |
| Bollinger Bands (4H) | Tightening, breakout expected |
| MFI (4H) | 48.66 (neutral flow) |
| Smart Money CHoCH | $167.30 (breakout trigger) |
| Derivatives OI | $8.16B (+2.49%) |
| Binance Top Trader Ratio | 2.71 (long-heavy bias) |
What’s Happening With Solana’s Price?
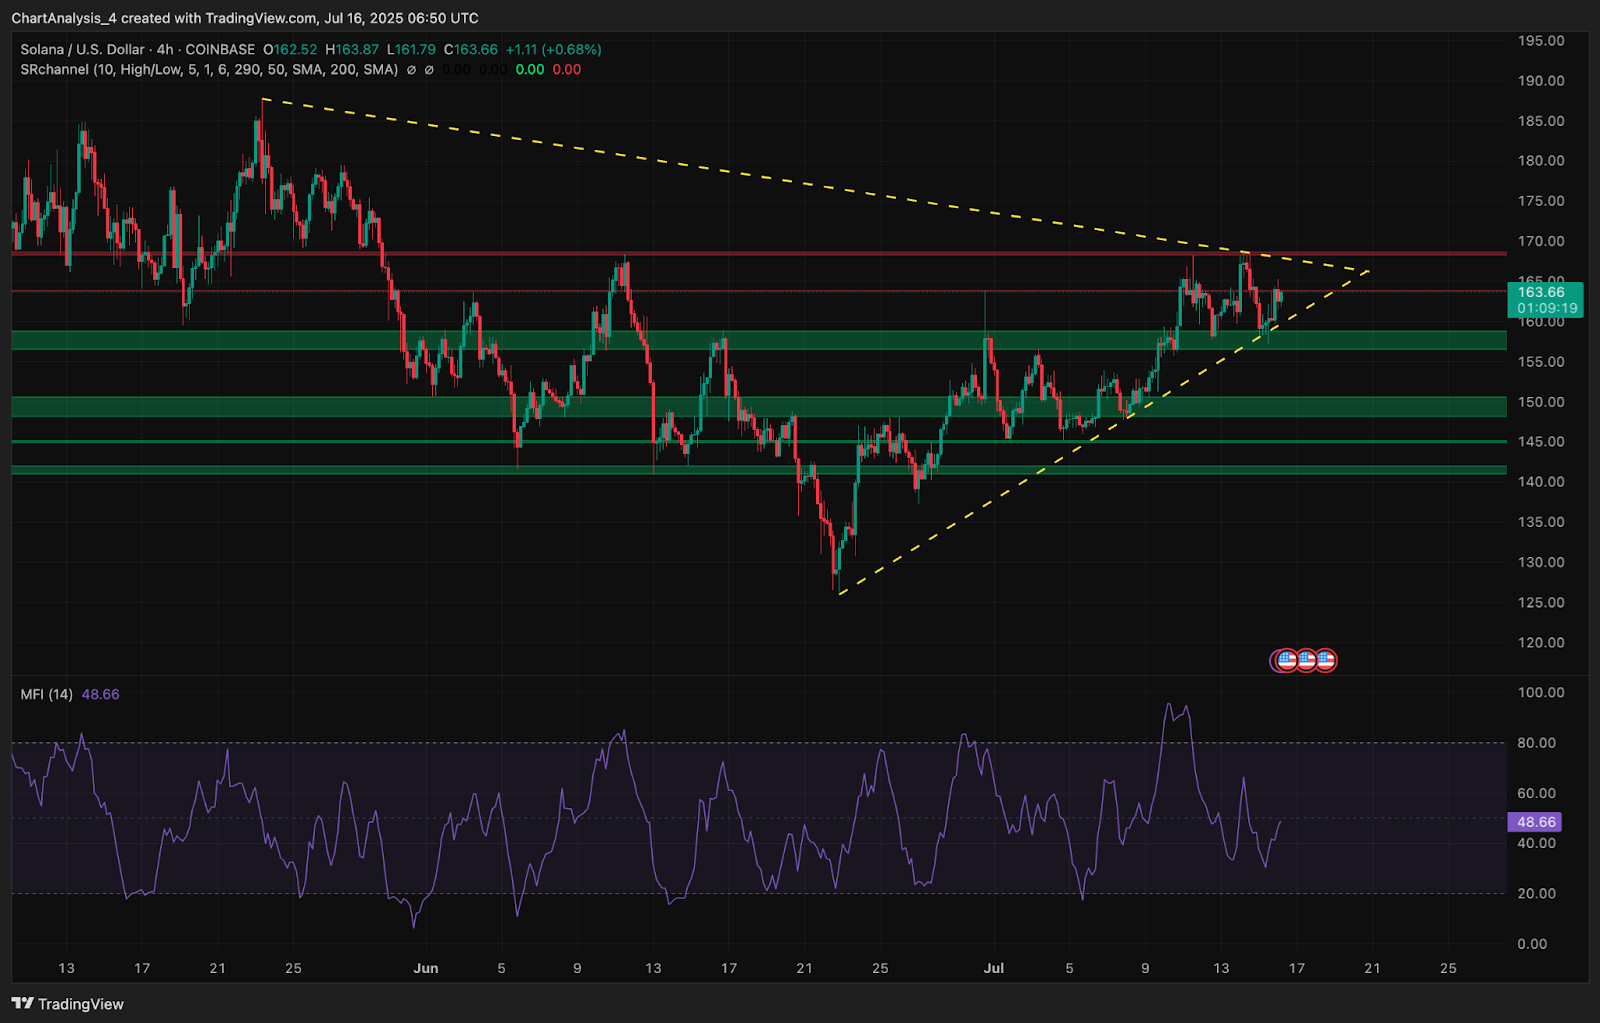
Solana price is consolidating just below the $167.30 resistance, forming higher lows against flat resistance, a typical ascending triangle structure. Price action has remained inside this tightening zone since early July, with visible trendline support from $142 and overhead resistance capped below $170. A breakout or breakdown from this structure could define the next leg.
Money Flow Index (MFI) on the 4-hour chart is neutral at 48.66, showing no major inflow or outflow bias. This reinforces the triangle’s apex formation and the likelihood of a decisive move.
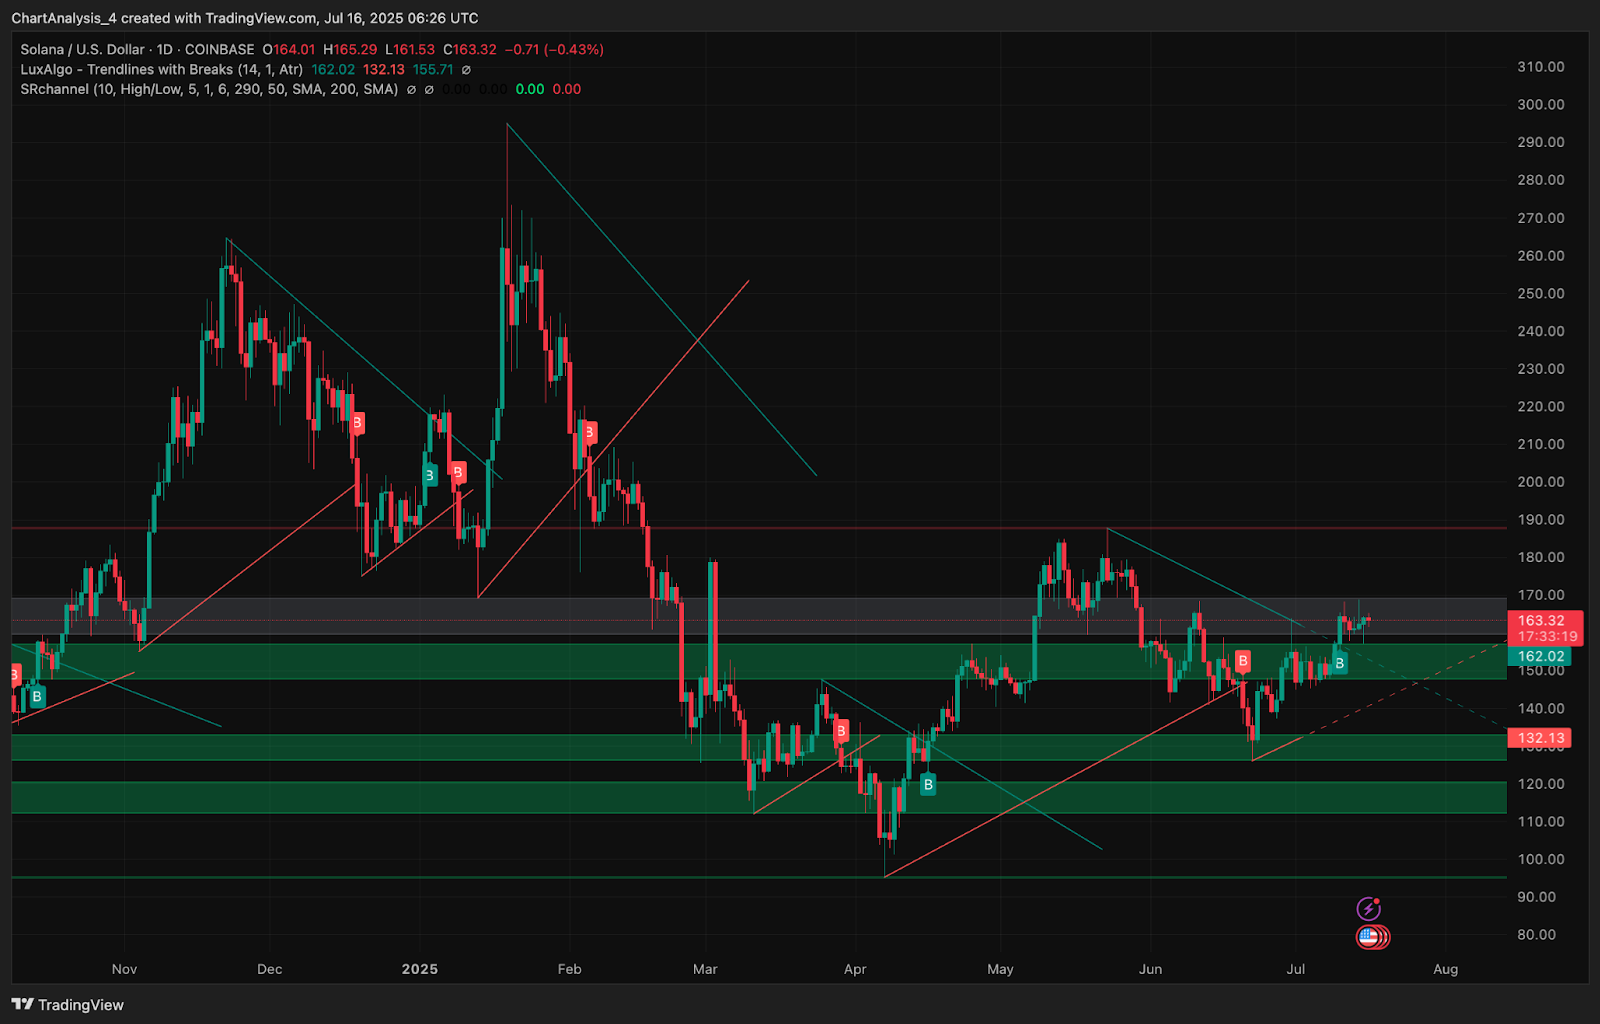
On the daily chart, the $162–$164 band continues to serve as an active pivot zone, reinforced by strong historical volume and trendline convergence. Liquidity zone analysis shows a prior break of structure (BOS) and a recent CHoCH (change of character) within the $160–$167 area, supporting a potential bullish continuation if volume expands.
Why is the Solana Price Going up Today?
Why Solana price going up today is primarily attributed to the broader bullish narrative created by the Pump.fun ICO, which raised $600 million in minutes directly on the Solana blockchain. With over 10,000 wallets contributing and 75.2% of capital raised on-chain, the event validated Solana’s claims of scalability and low-cost execution. The average wallet contributed just $539, reflecting strong retail confidence.
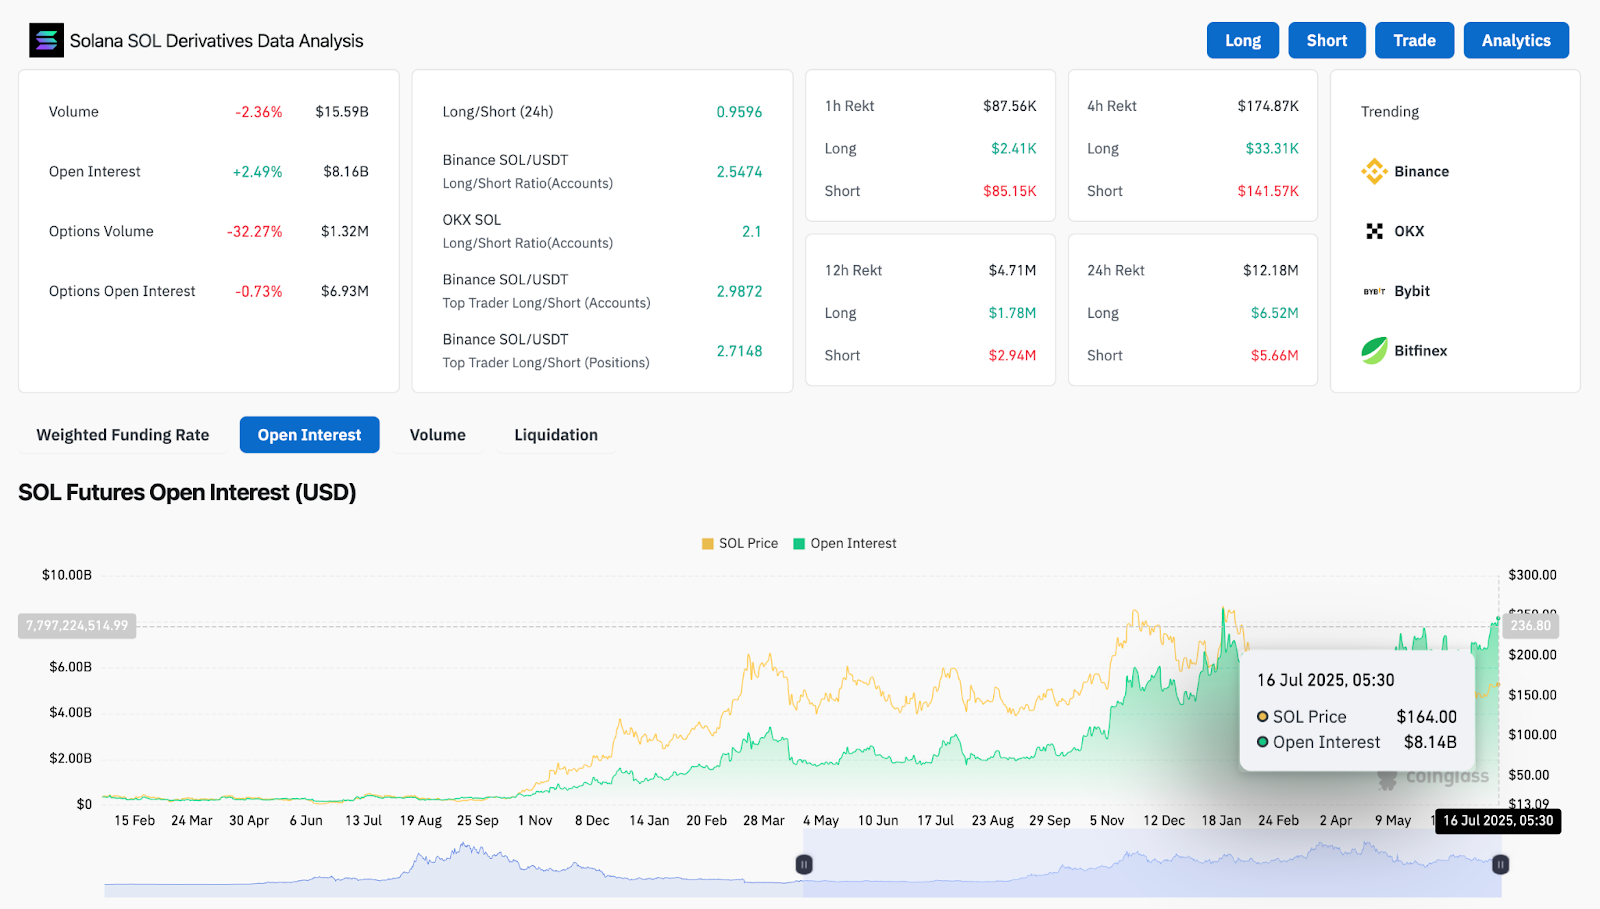
On the derivative side, open interest is up 2.49% to $8.16 billion, signaling increased participation. Binance’s long/short ratios are skewed bullish, with top trader positioning at 2.71. While options volume dipped, spot-driven interest remains elevated. This capital inflow coincides with the price’s push into compression resistance zones, creating a potent mix of sentiment and structural momentum.
Price Structure and Indicator Outlook
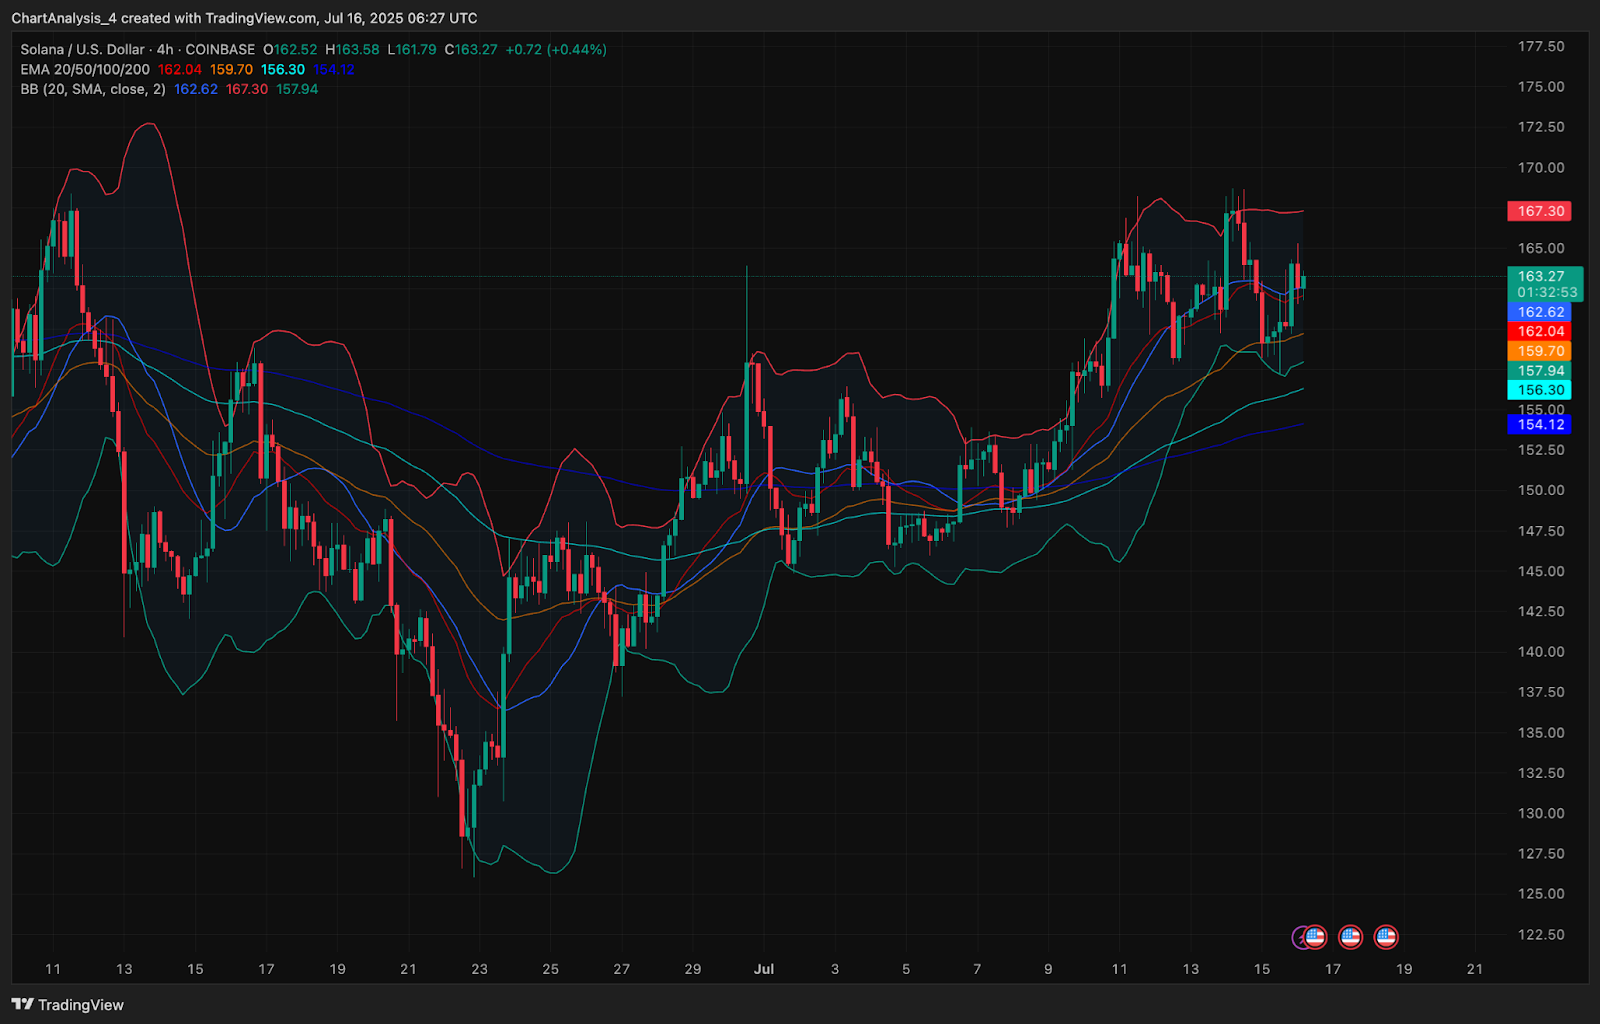
On the 4-hour timeframe, Solana price action shows clear support from the 20/50/100 EMA cluster between $156 and $162. The 200 EMA sits at $154.12, acting as a deeper safety net if price rejects at resistance. Bollinger Bands are compressing, hinting at a volatility expansion event. Price currently tests the mid-band around $162.67, with upper band resistance at $167.30.
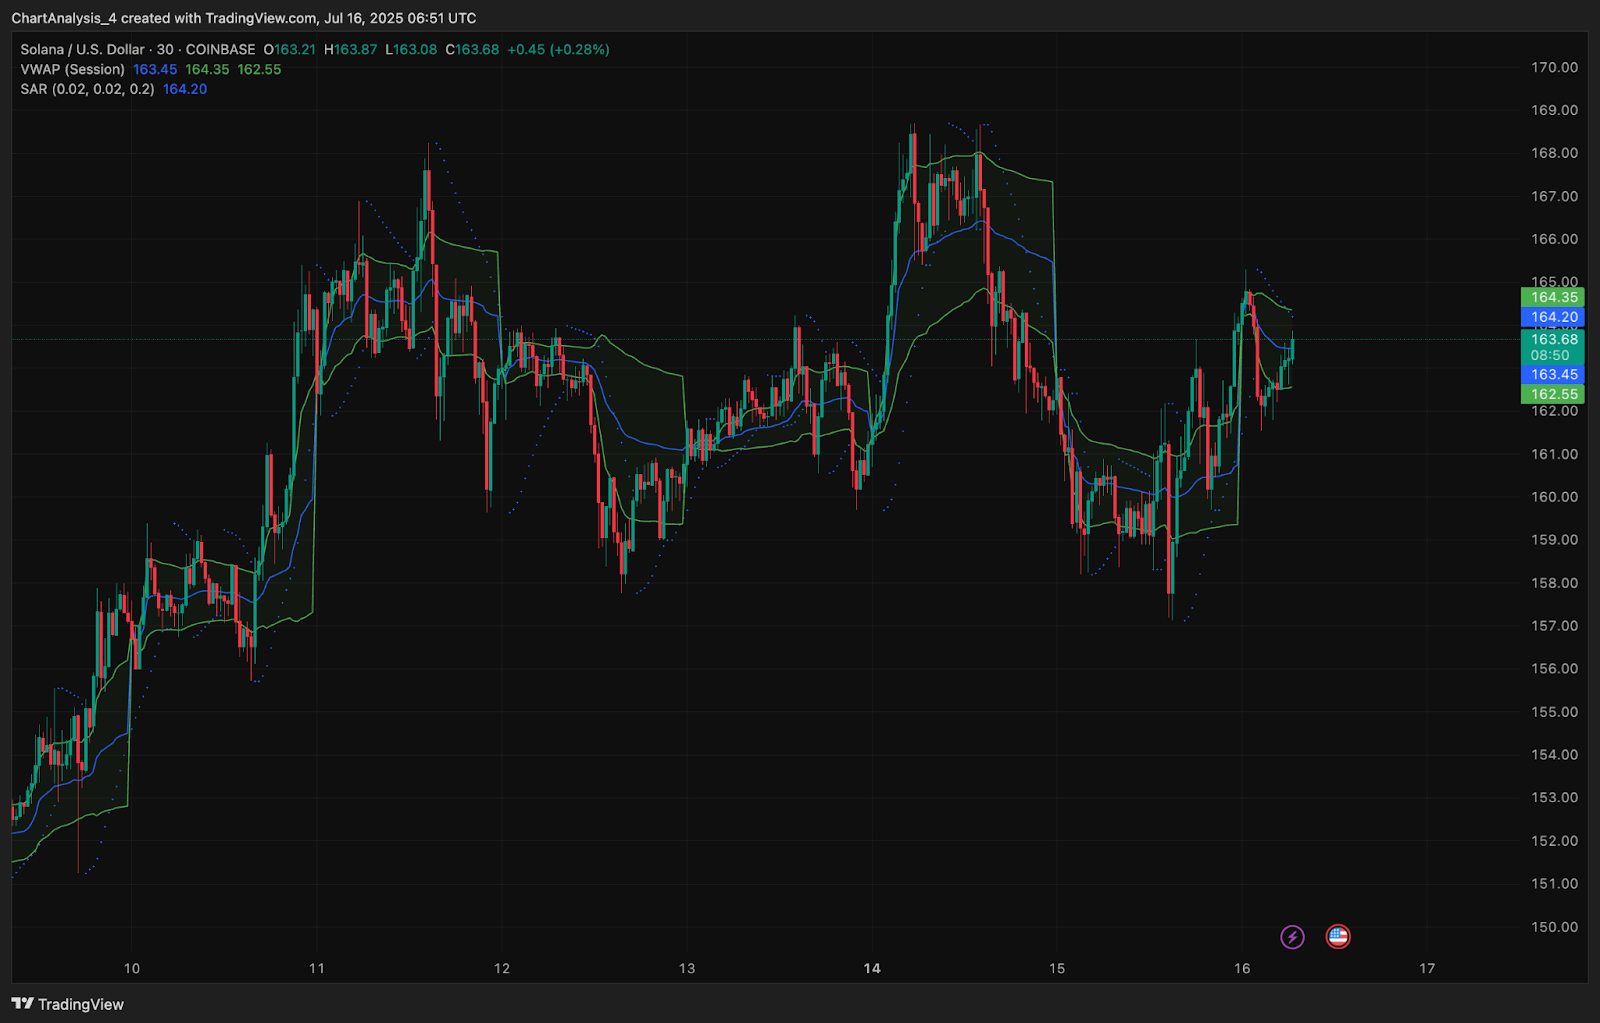
The 30-minute chart reveals consolidation above the VWAP ($163.45) and below session SAR ($164.20), suggesting a narrow range intraday bias.
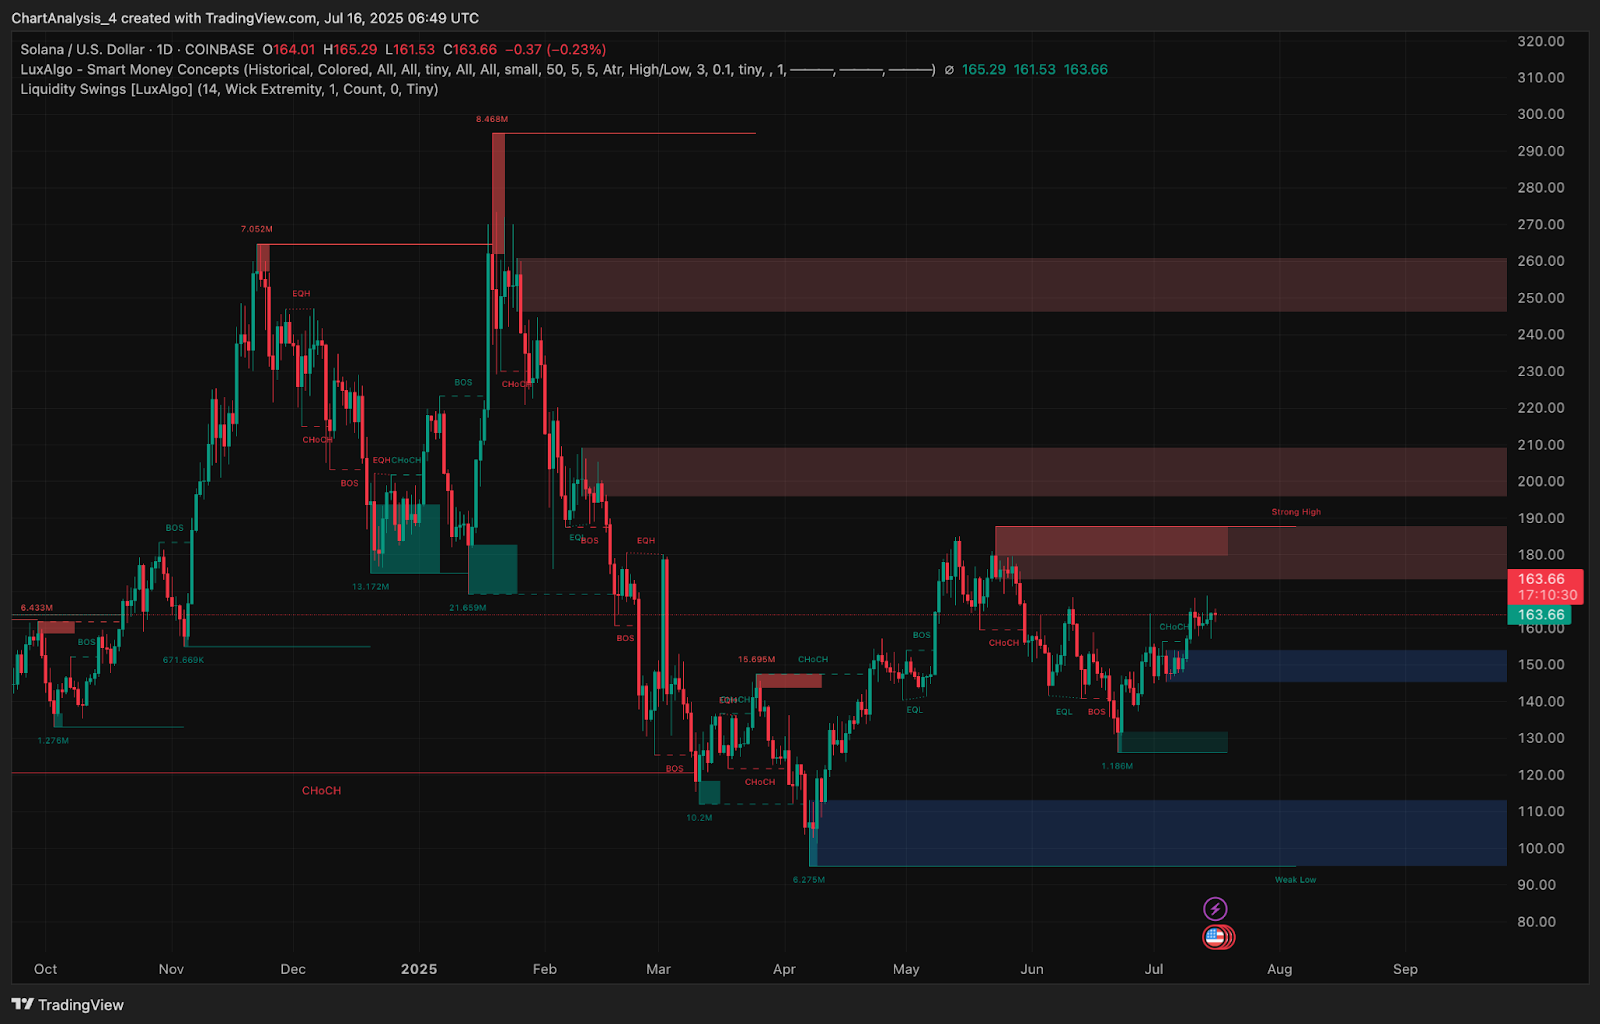
Smart Money Concepts also reveal key liquidity resting above $170 and below $160. A break above the CHoCH zone at $167.30 would trigger a short squeeze into the $178–$185 supply band. On the flip side, failure to hold above $162 could see a retreat to the $156–$158 imbalance zone.
Solana Price Prediction Short-Term Outlook (24h)
If Solana price today breaks above $167.30 with confirmation volume, a push toward $178 becomes likely, with the next zone of interest near $185. This would also confirm breakout from the ascending triangle and resolve the multi-session compression structure.
If bulls fail to hold above $162.00, a corrective drop toward $156.00 is likely, followed by deeper demand between $150.00 and $145.00. The price structure remains constructive as long as price trades above the ascending trendline from June lows.
Given the mix of neutral oscillators, bullish EMA alignment, and rising open interest, the short-term bias leans cautiously bullish. However, traders should await confirmation from volume expansion and candle structure above $167.
Disclaimer: The information presented in this article is for informational and educational purposes only. The article does not constitute financial advice or advice of any kind. Coin Edition is not responsible for any losses incurred as a result of the utilization of content, products, or services mentioned. Readers are advised to exercise caution before taking any action related to the company.


