 Price Prediction For July 2025")
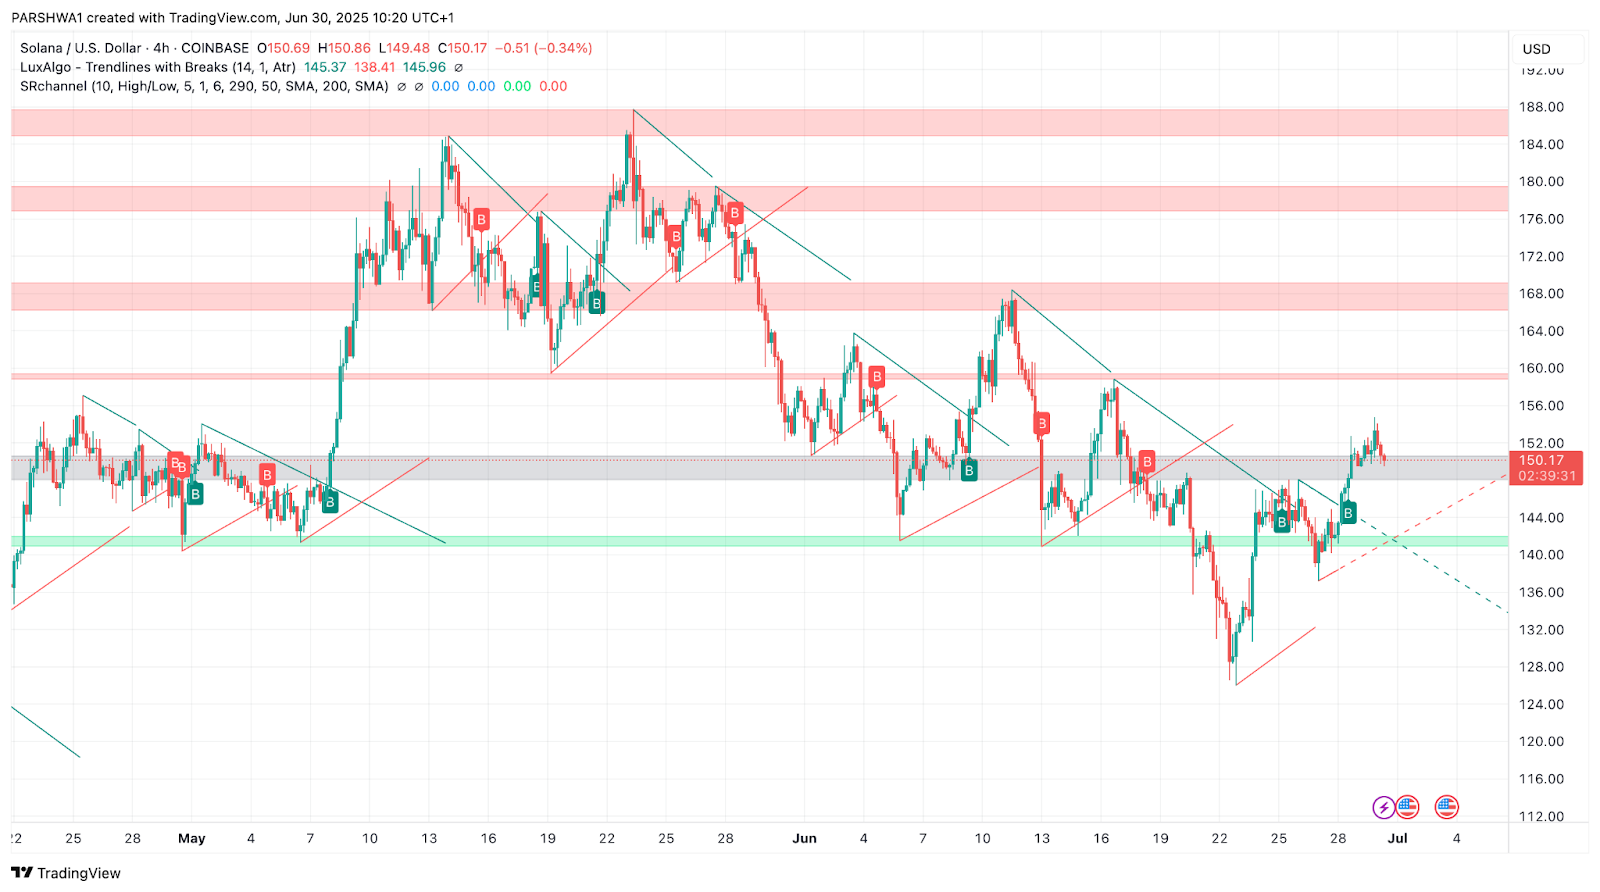
Solana closed June near $150, recovering from a local low around $136 earlier in the month. The SOL price today is trading below a critical confluence of resistance levels while consolidating within a larger symmetrical triangle structure. With compression tightening and macro support holding, July could be pivotal for directional resolution.
Solana Price Prediction for July 2025
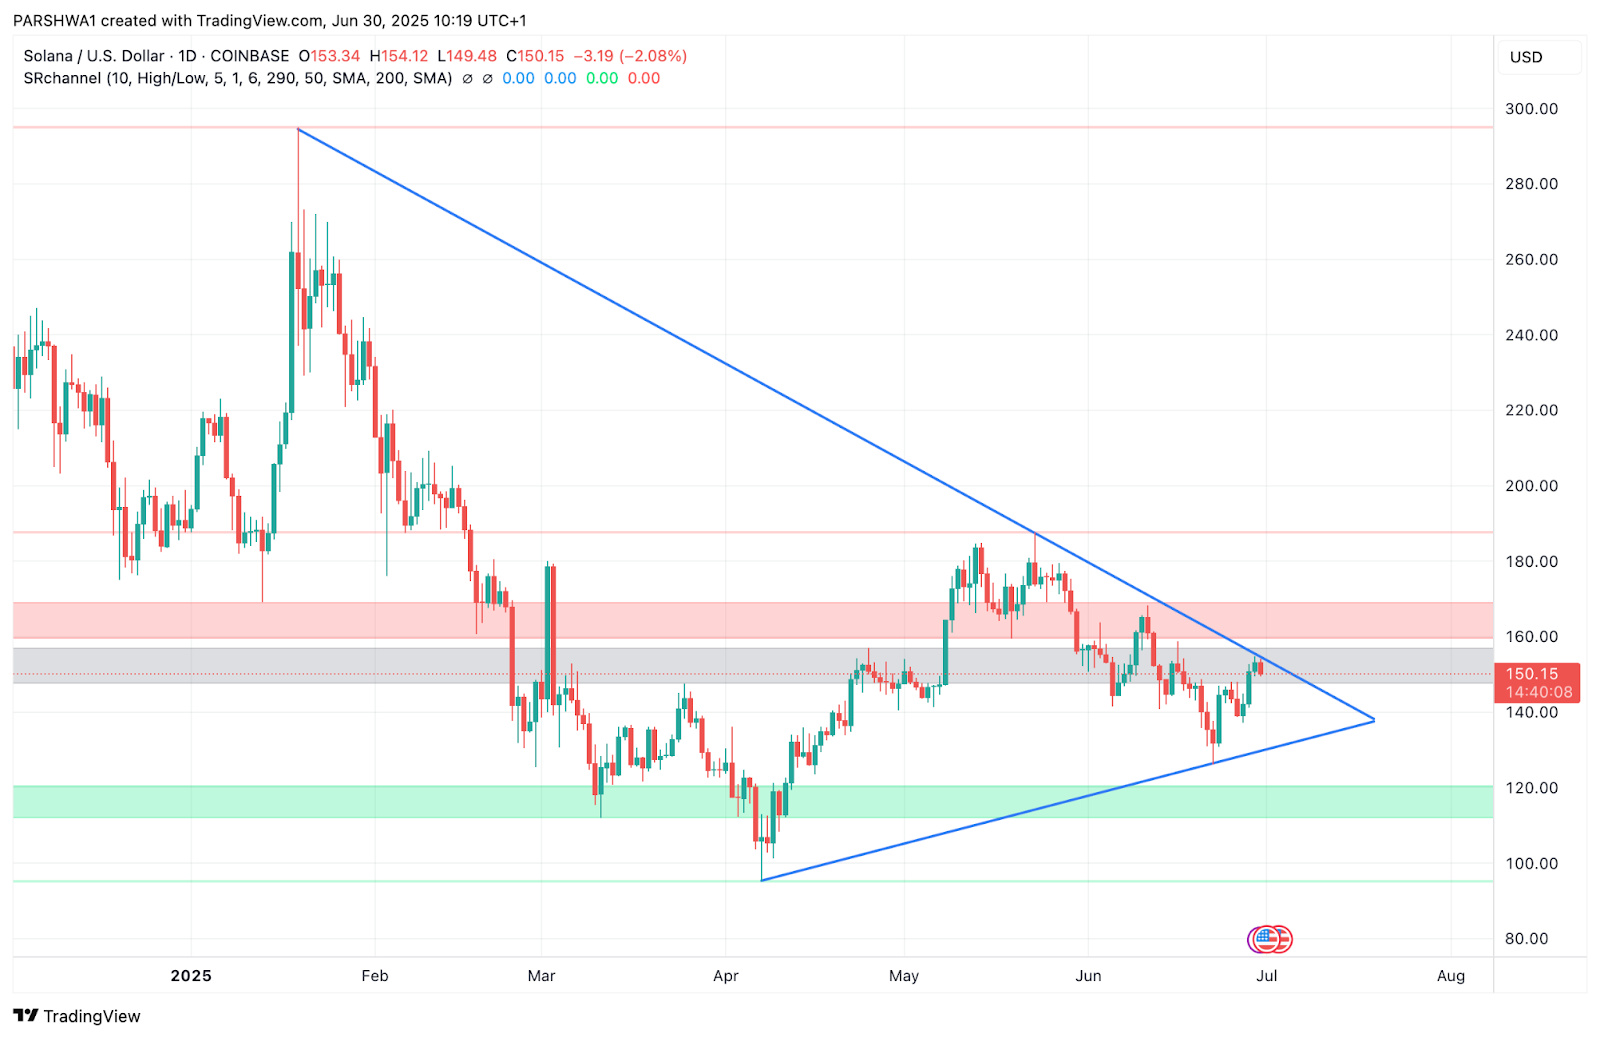
Solana’s price structure heading into July 2025 is defined by symmetrical triangle compression on the daily chart. The descending resistance from the March high and ascending support from April’s low are converging near the $150–$153 zone, suggesting a breakout is likely this month. The triangle resistance overlaps with the key 0.618–0.705 Fibonacci retracement levels ($152.37–$165.88), making this a crucial region for bulls to overcome.
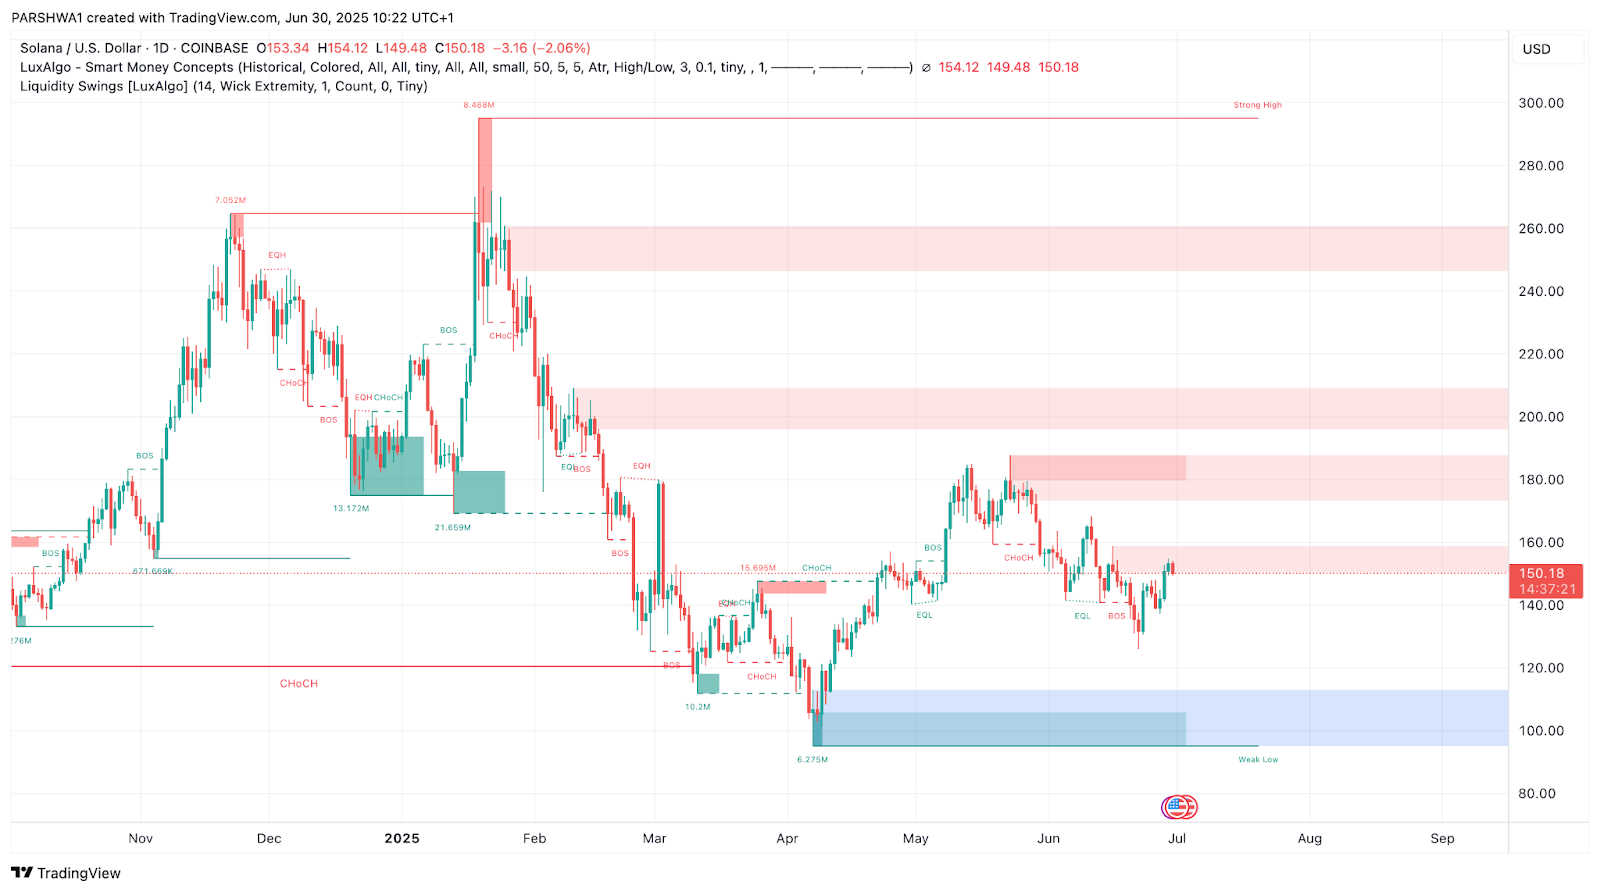
Meanwhile, the SMC chart shows a series of CHoCH and BOS formations near $135–$155, with visible liquidity resting above $165 and below $130. The price has not yet taken out equal highs near $160, making that a magnet zone for any bullish continuation in early July.
Solana Price Indicators, Signals, Graphs and Charts (1M)
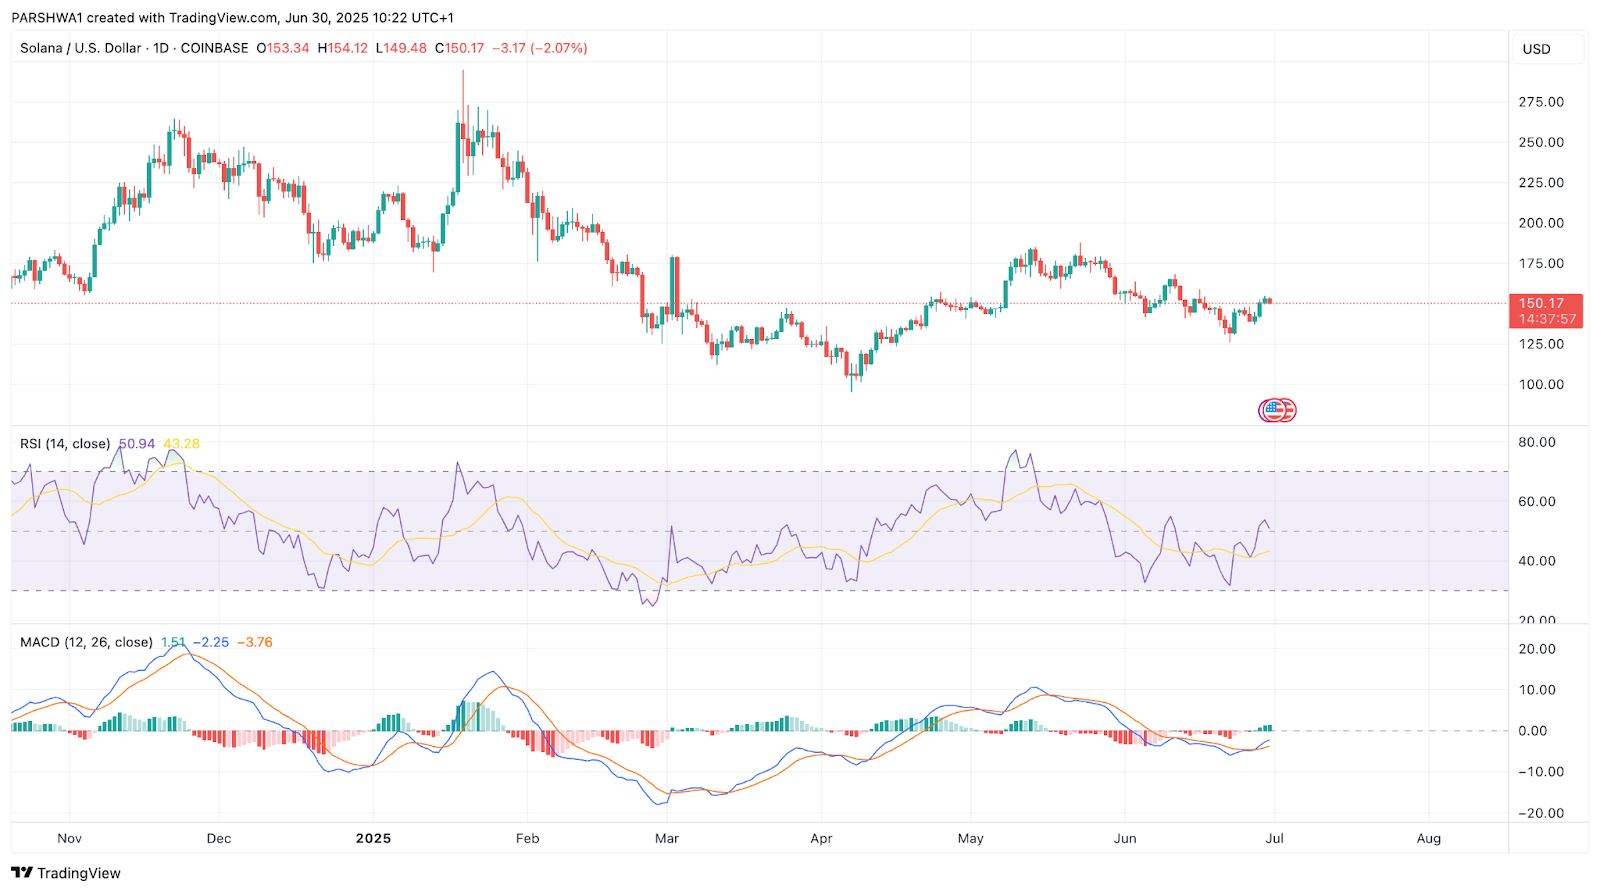
The RSI (14) on the daily timeframe is currently at 50.94, sitting exactly at the midpoint, indicating a state of equilibrium between bulls and bears. The RSI has rebounded from near-oversold conditions in mid-June but has yet to confirm sustained bullish momentum.
MACD (12, 26) is attempting a bullish crossover, with the MACD line curling back toward the signal line after forming a higher low. The histogram is also ticking upward, hinting at early signs of a momentum shift, though confirmation remains pending.
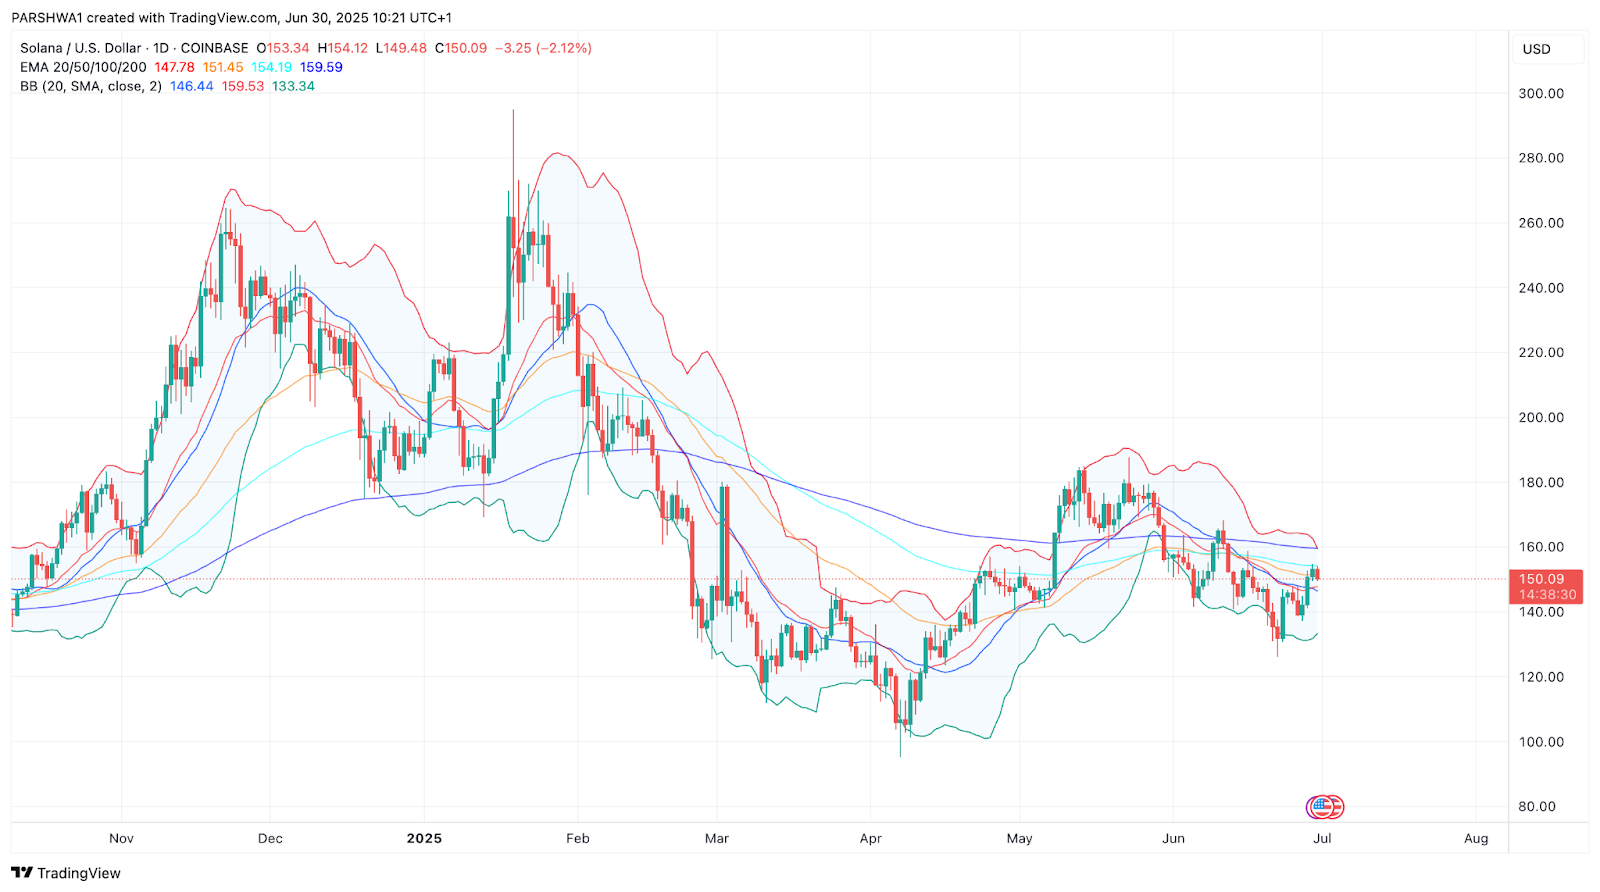
Bollinger Bands are moderately compressed, with price hovering just below the mid-band (~$150.09). The upper band near $159.53 and lower band at $133.34 represent the likely breakout thresholds. A decisive close beyond either could catalyze significant follow-through.
EMA levels present tight resistance ahead. SOL is currently trading between the 20-day EMA ($147.78) and the 50-EMA ($151.45), while the 100-EMA ($154.19) and 200-EMA ($159.59) cluster overhead. This EMA stack creates a layered resistance block, and clearing it is essential for any bullish advance to take hold.
What to Expect From Solana Price This Month?
In July, Solana’s price is expected to test the limits of its symmetrical triangle structure. A breakout above $153 could invite a retest of the upper resistance zone near $165.88. If momentum builds beyond this, bulls may aim for the broader Fibonacci target of $175 and potentially $187, where the March 2025 high rests.
However, a failure to hold above the 0.618 support at $141.44 may lead to renewed downside pressure, with the next key support located at $130.52 (0.5 Fib) followed by the high-volume node near $115. A breakdown from the triangle’s lower boundary could accelerate toward the demand zone at $95–$100.
With narrowing volatility and key SMC levels aligning around this zone, a strong breakout move is increasingly likely by mid to late July.
Can Solana Price Hit $165 This Month?
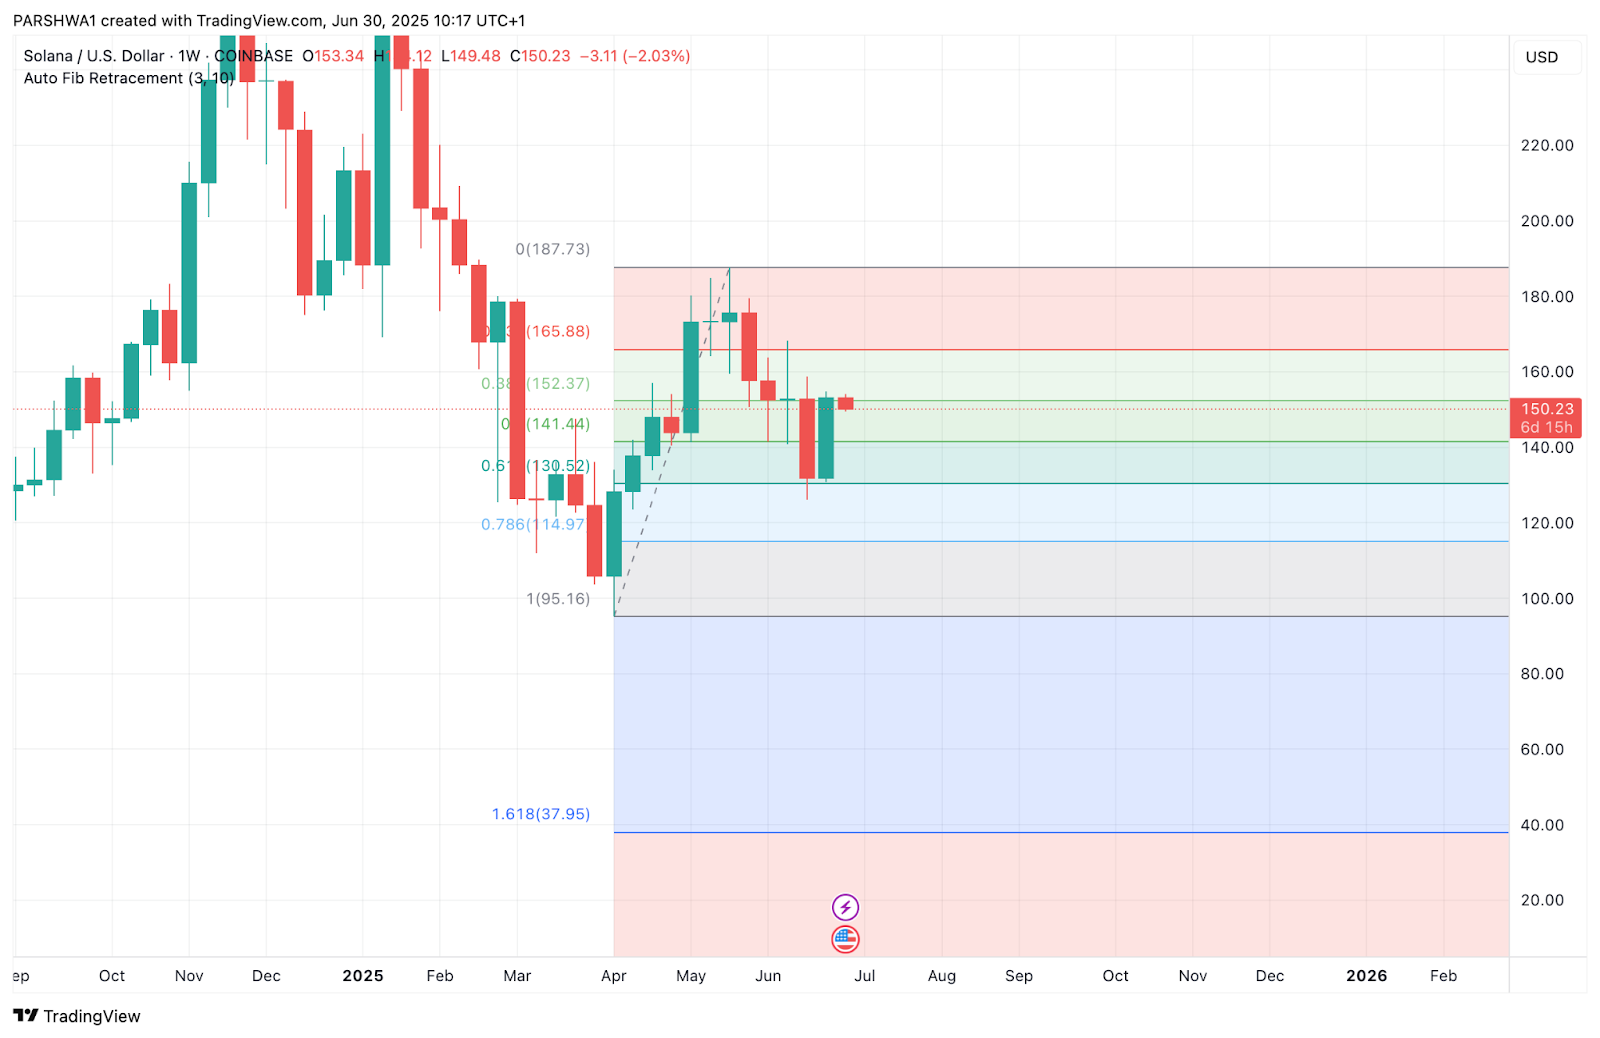
Solana has a viable chance to revisit the $165 level in July, but this will require a successful breakout above the current triangle resistance. The confluence of the 0.705 Fibonacci retracement and multiple supply zones near $160–$165 makes this area a magnet for liquidity if bulls manage to break above $153.
However, the path to $165 remains conditional. Bitcoin and Ethereum’s broader strength, combined with sustained volume and momentum from altcoin rotations, would likely be needed to support such a move. A clean break of the $130 support, on the other hand, would invalidate the bullish scenario and shift focus to $115 and lower.
Conclusion
The Solana price prediction for July 2025 centers on an imminent breakout from a long-standing symmetrical triangle pattern. Indicators show early bullish potential, but strong resistance near $153–$160 must be cleared to confirm upside continuation. If successful, SOL could target $165 and $175. On the downside, watch $141 and $130 as key support zones. July is likely to produce a high-momentum move that sets the tone for Q3.
Disclaimer: The information presented in this article is for informational and educational purposes only. The article does not constitute financial advice or advice of any kind. Coin Edition is not responsible for any losses incurred as a result of the utilization of content, products, or services mentioned. Readers are advised to exercise caution before taking any action related to the company.
 Price Prediction: Weak Momentum Signals Possible Drop to $62K")

 Price Prediction for April 2026: Will Chainlink Move Higher?")
 Price Prediction: Can Bulls Sustain the $0.045 Push?")
