 Price Prediction for July 22")
After weeks of steady ascent, Solana price has reached the upper trendline of a rising wedge pattern, trading at $186.05 at the time of writing. The current zone aligns with historical resistance, and traders are closely watching for a breakout toward $200 or a possible rejection back toward support at $175.
What’s Happening With Solana’s Price?
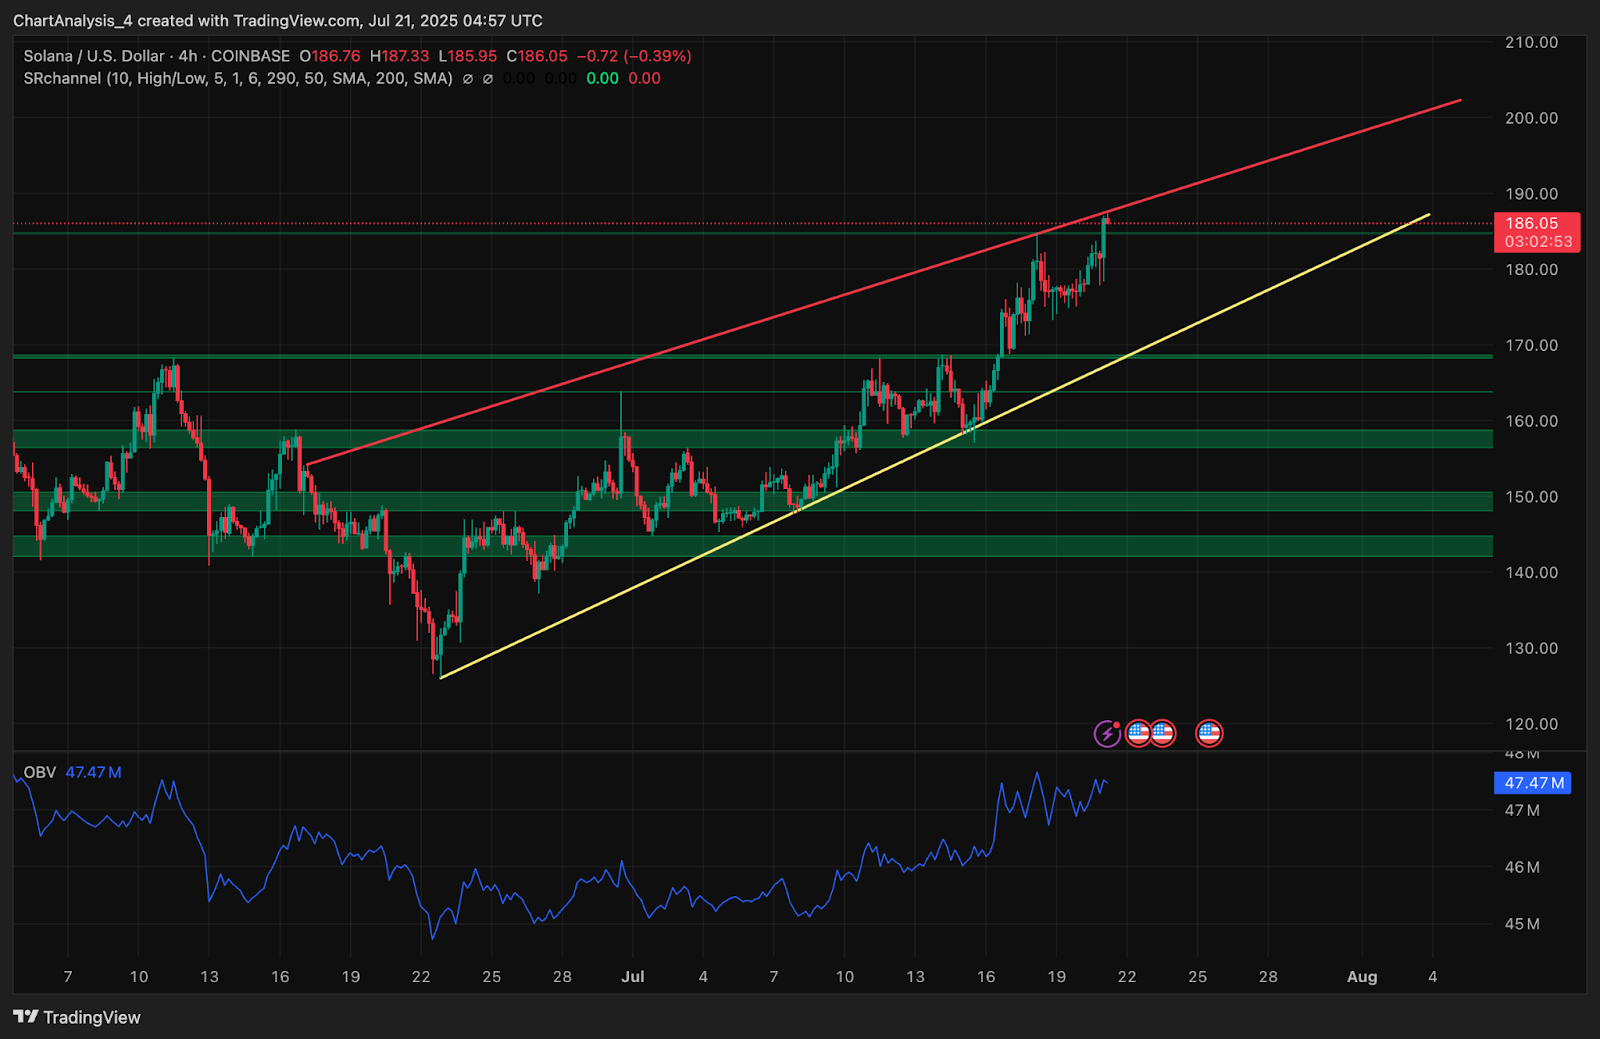
On the 4-hour timeframe, Solana price action has moved inside a clearly defined rising wedge structure, with ascending support around $175 and resistance capping price near $187. The wedge follows a series of higher highs and higher lows dating back to late June, reinforcing a bullish structure. Price is now testing the upper trendline for the third time, raising the stakes for a breakout or rejection in the coming session.
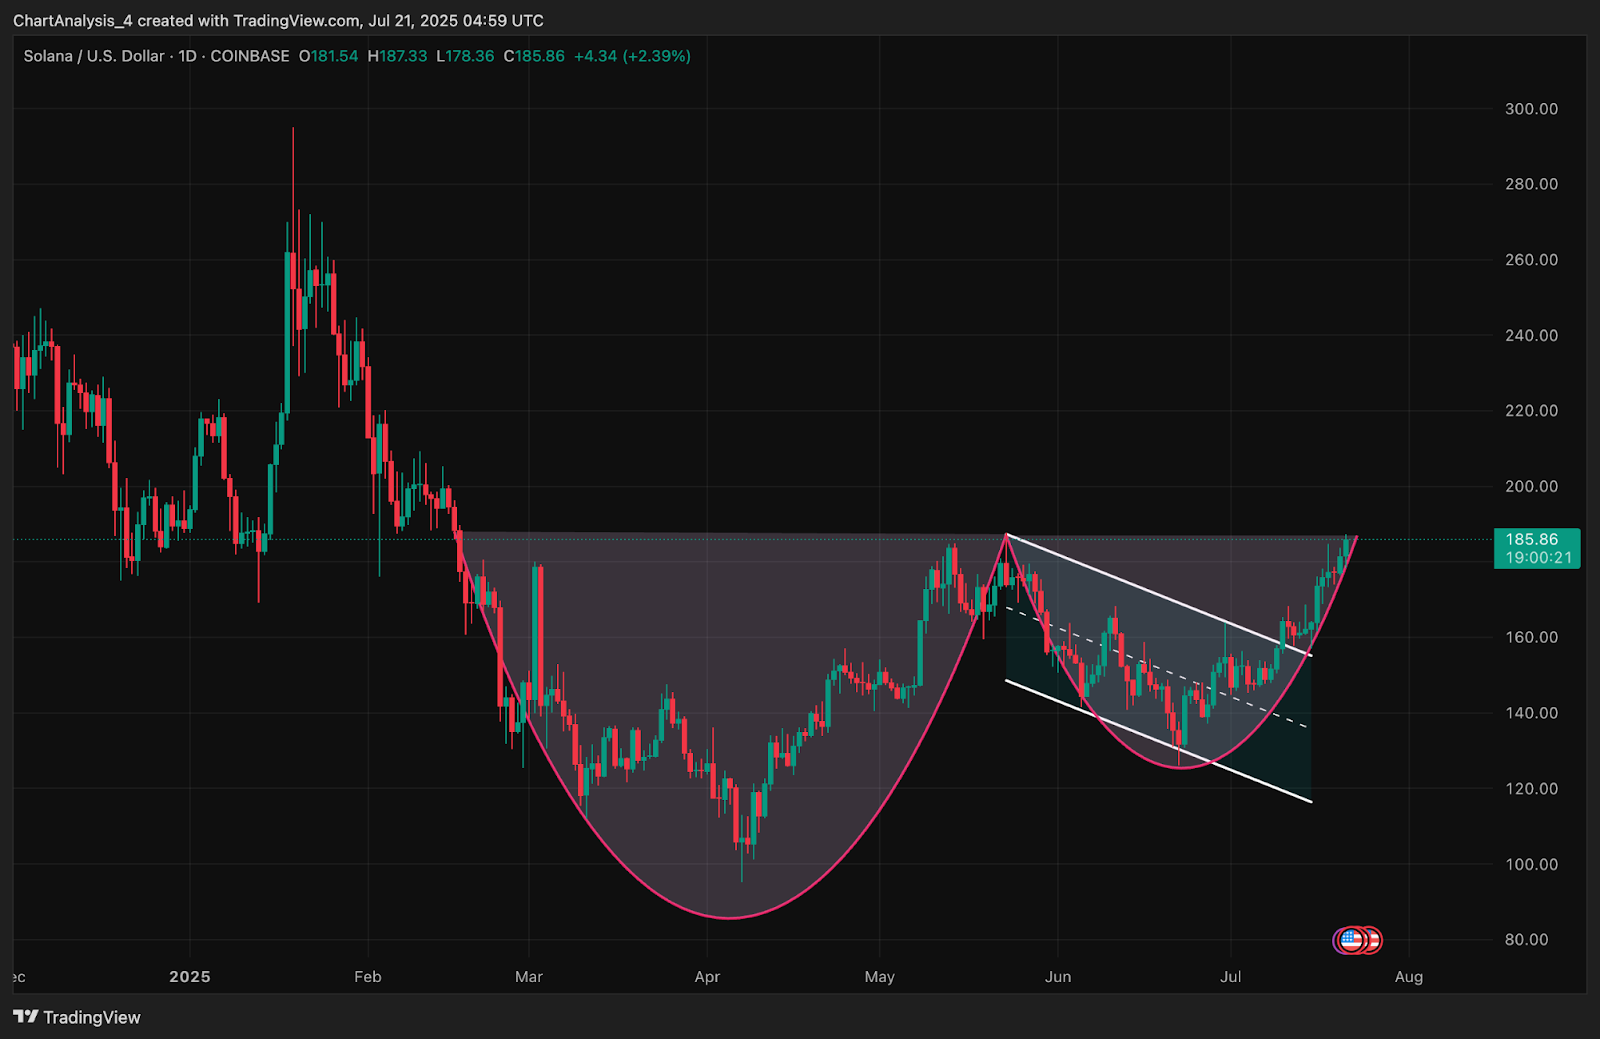
On the daily chart, Solana appears to be completing a macro cup and handle formation. The handle portion formed through June’s consolidation and the current rally is bringing price back toward the neckline near $188. If this pattern confirms with a breakout, it would imply a larger trend shift with upside potential toward $220 and beyond.
Why Is The Solana Price Going Up Today?
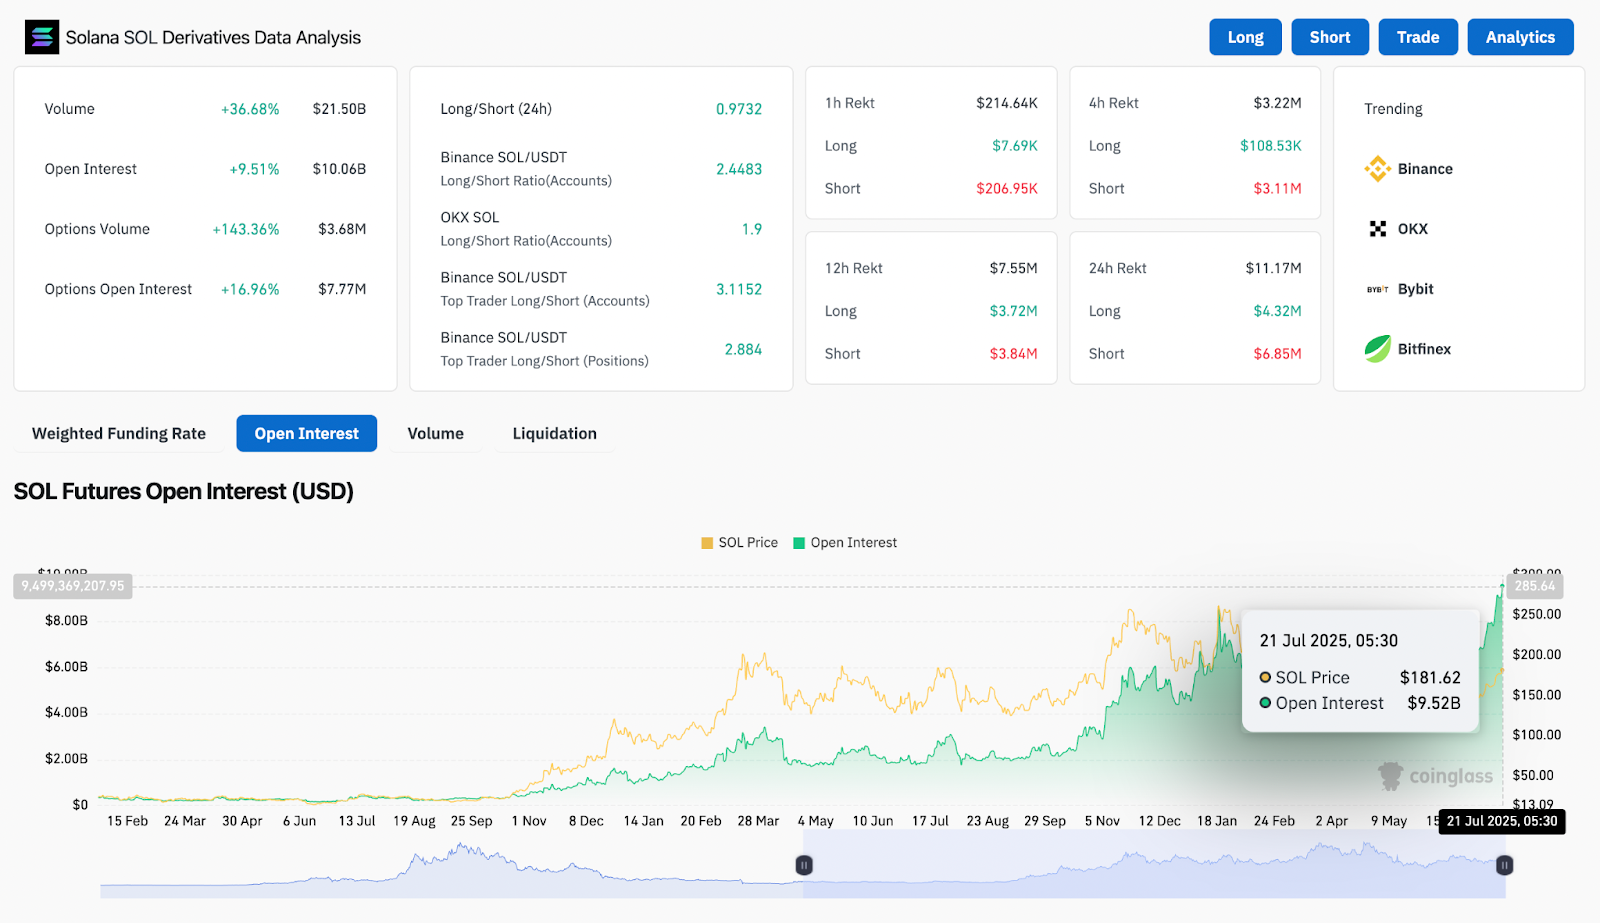
Why Solana price going up today is largely driven by strong technical continuation and aggressive bullish positioning in derivatives. According to Coinglass, open interest surged 9.51% to $10.06B, while total volume jumped over 36% to $21.5B in the past 24 hours. Options volume has also spiked 143%, indicating rising speculative interest.
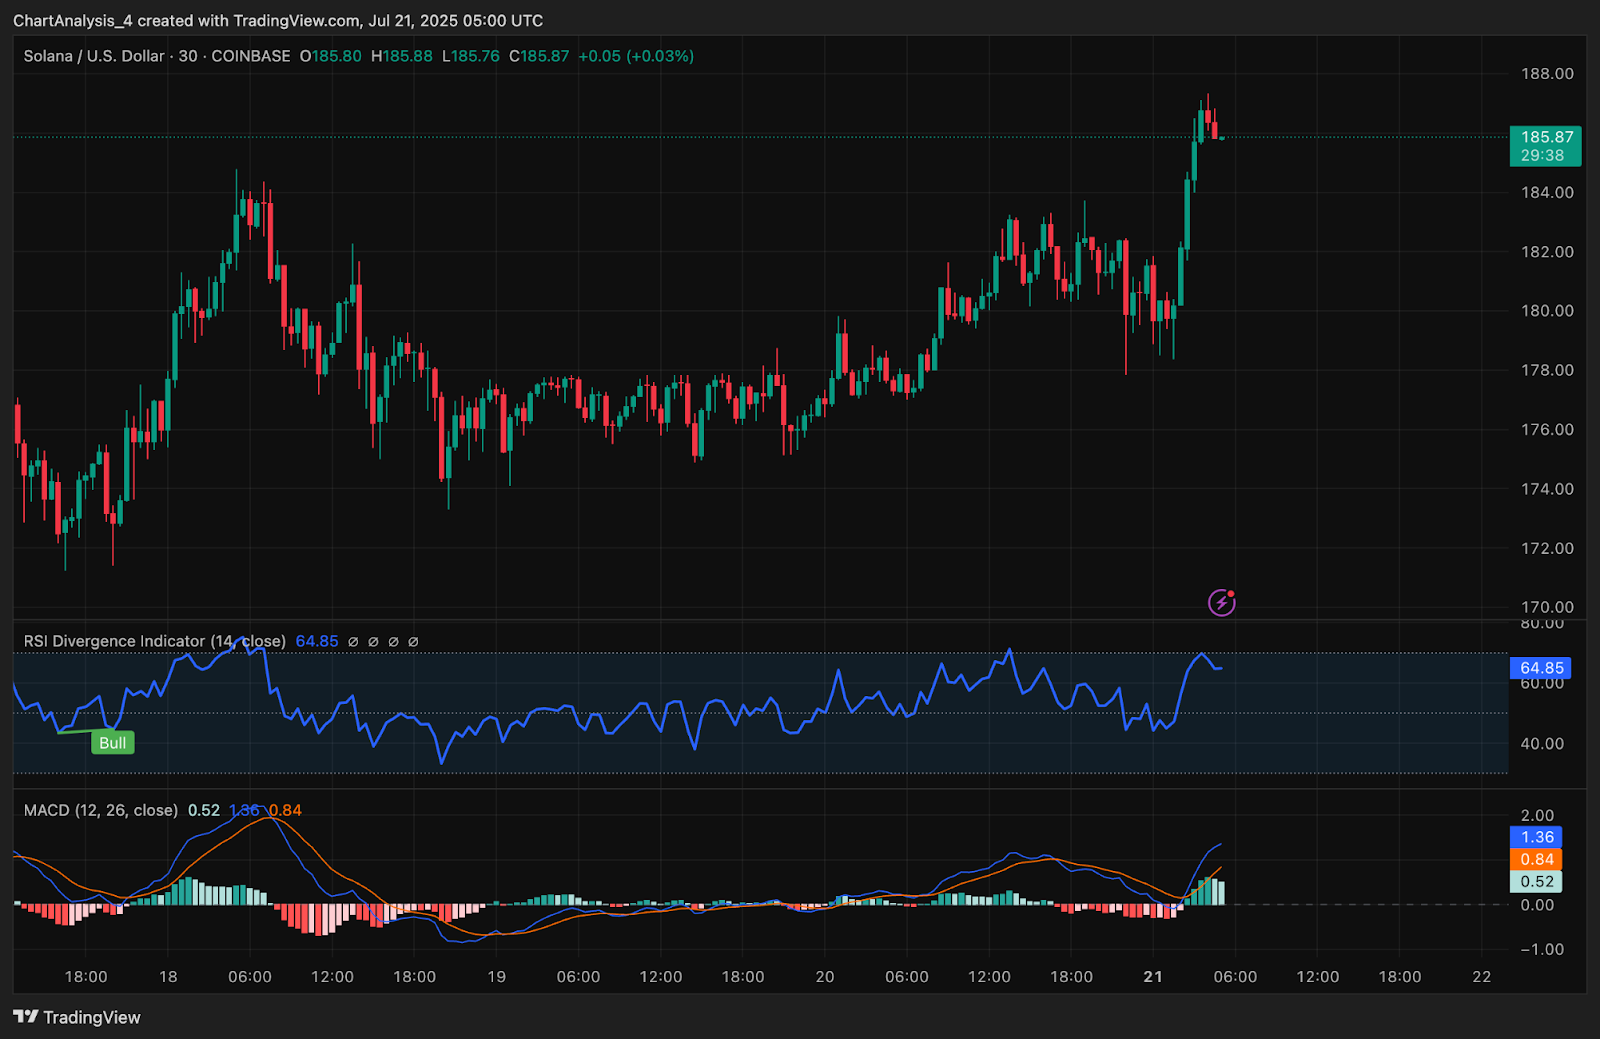
Momentum indicators confirm this bullish pressure. The 30-minute chart shows RSI at 64.85 with a bullish divergence signal earlier today. MACD has flipped strongly positive, reinforcing the short-term momentum favoring buyers. On the 4-hour chart, OBV is trending upward with no bearish divergence, indicating healthy accumulation even as price nears a breakout level.
Momentum Indicators Point to Strength as Wedge Tightens
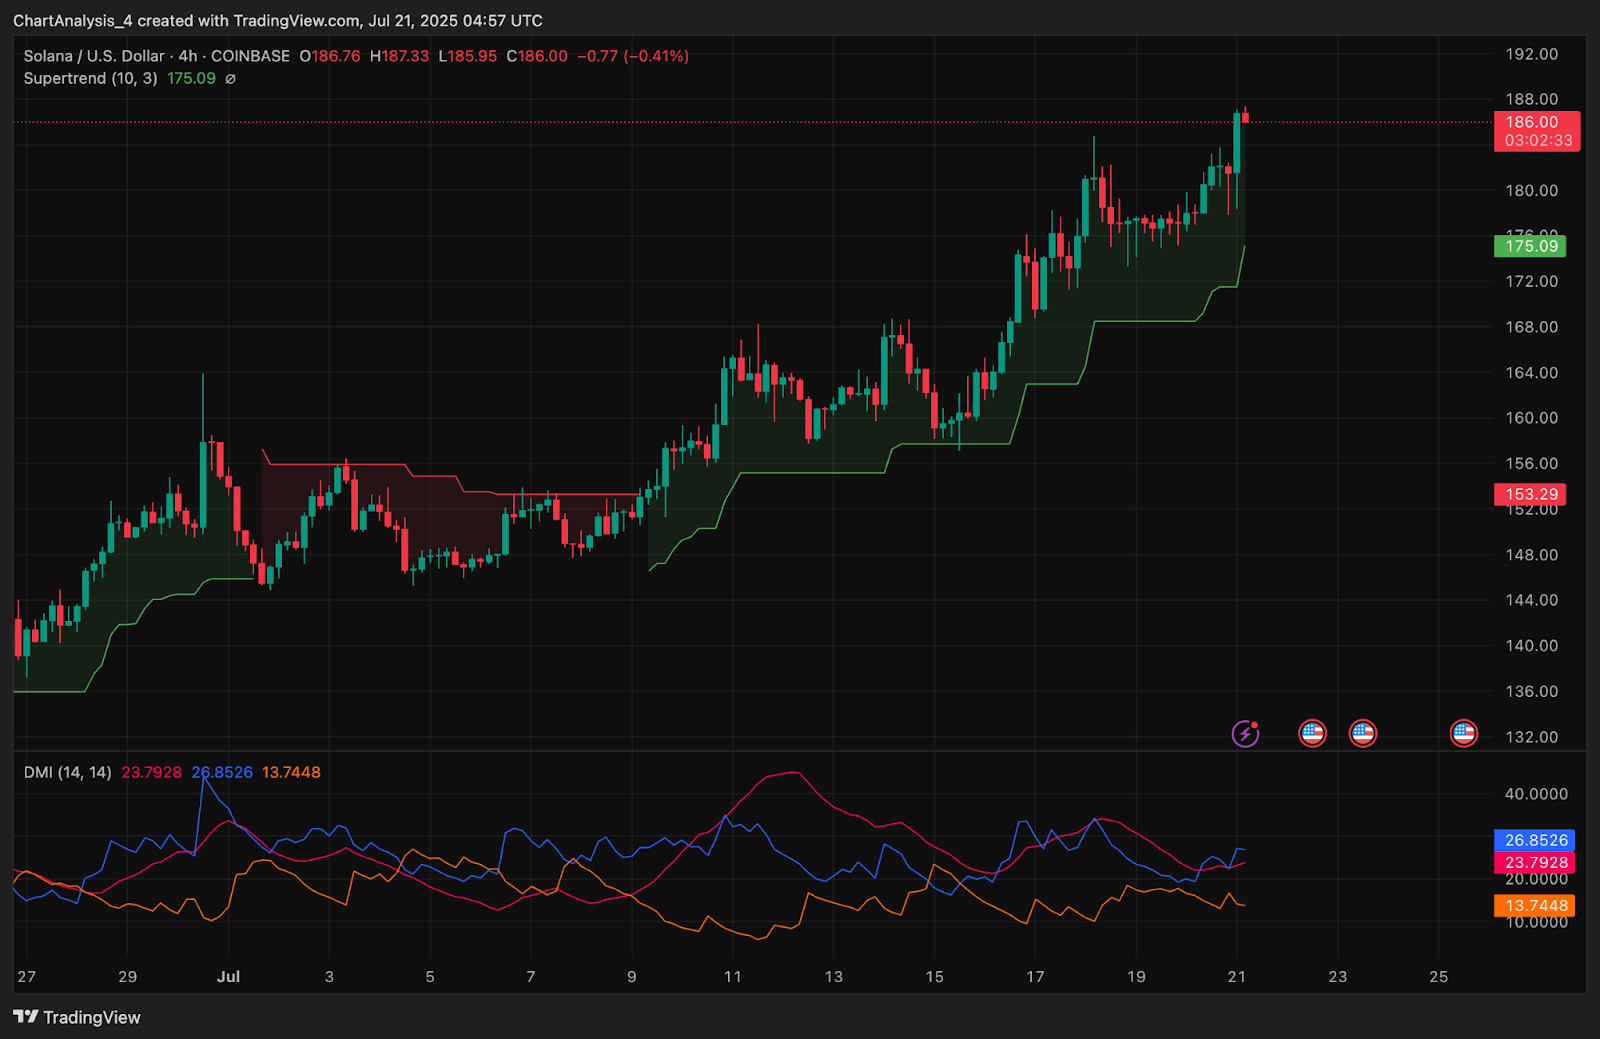
Solana remains supported by multiple key indicators. The 4-hour DMI shows +DI (26.85) holding above -DI (23.79) with an ADX above 13, suggesting a trending market, albeit with caution as directional strength could still develop further. The Supertrend has flipped bullish and trails price near $175, marking a dynamic support floor.
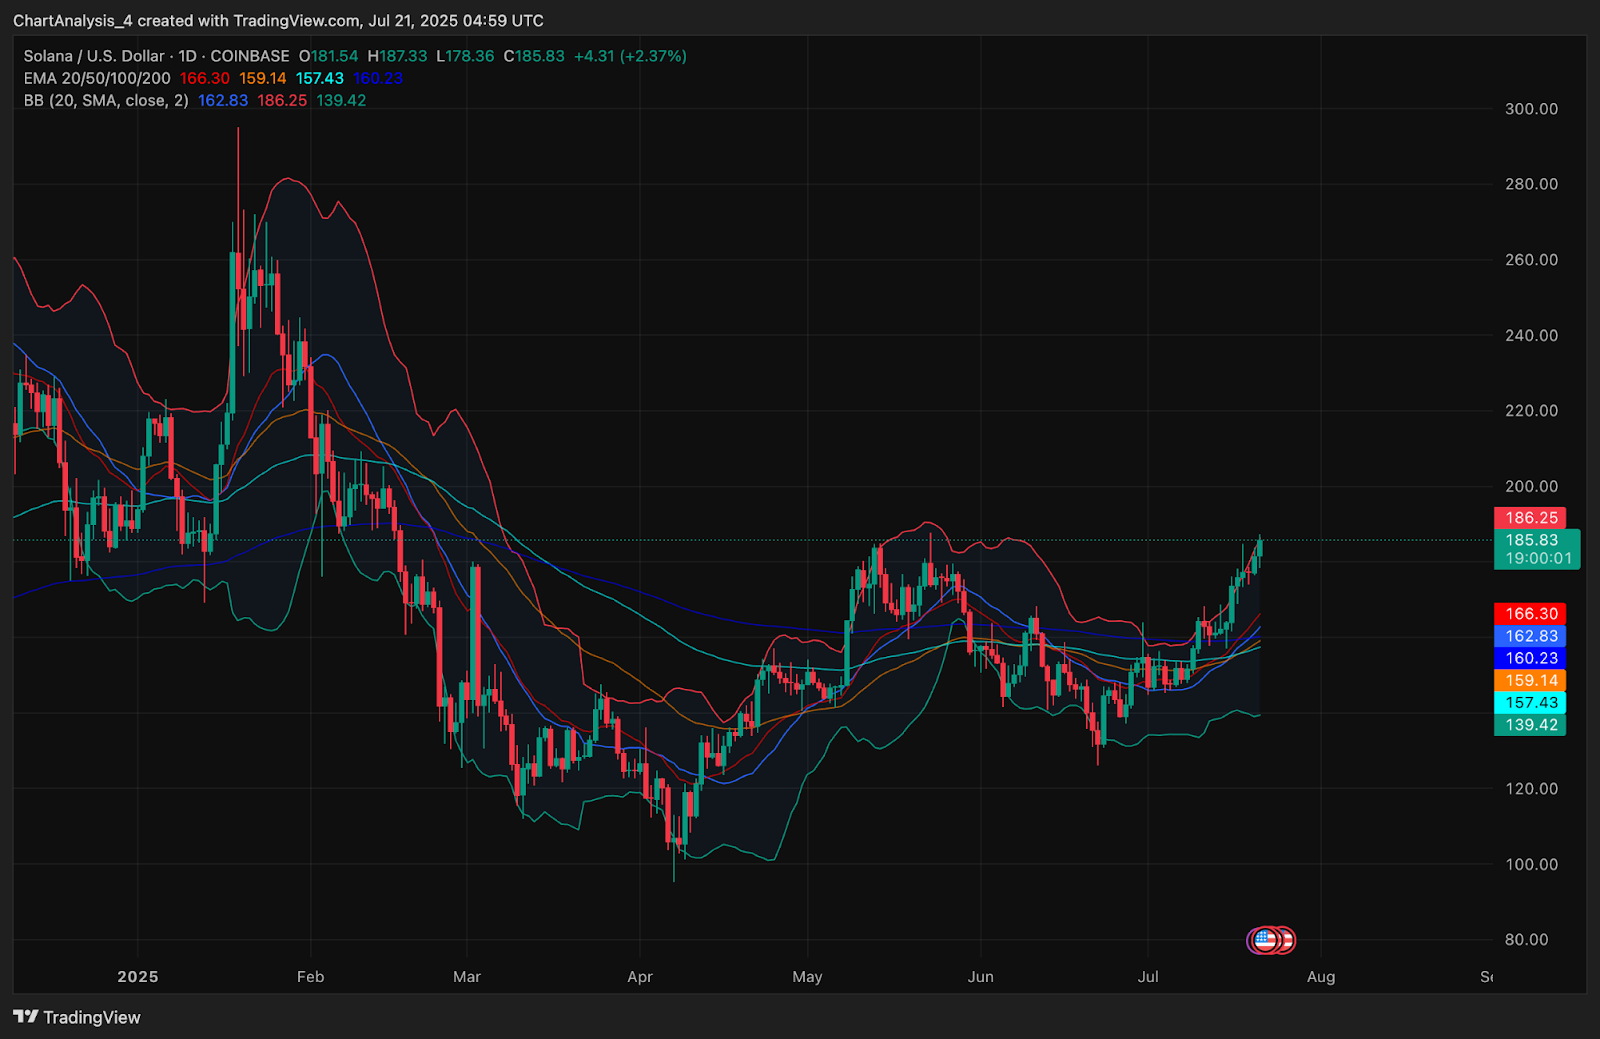
On the daily timeframe, Bollinger Bands have expanded as price pushes against the upper band at $186.25. This signals an ongoing bullish volatility phase. The 20/50/100/200 EMA cluster is stacked bullish below current price, with the 200 EMA around $139 and 20 EMA at $166, confirming strong trend support underneath.
Given this alignment of volume, price structure, and volatility expansion, Solana is now nearing a decision point between $186 and $190. A confirmed breakout could ignite the next leg of the rally.
SOL Price Prediction: Short-Term Outlook (24H)
Solana price is expected to remain volatile as it trades at the wedge resistance zone. A breakout above $188 with confirmation could accelerate toward $200, followed by $212, which corresponds to the measured move from the cup and handle breakout.
If rejection occurs, downside support begins near $175, where both the wedge base and Supertrend indicator converge. Deeper pullbacks could test $166 and $159, where the 20 and 50 EMAs offer dynamic support.
Given the strong on-chain, volume, and trend alignment, bulls remain in control for now. But traders should watch for price action around $188 to determine whether continuation or short-term exhaustion follows.
Solana Price Forecast Table: July 22, 2025
| Indicator/Zone | Level / Signal |
| Solana price today | $186.05 |
| Resistance 1 | $188 (rising wedge resistance) |
| Resistance 2 | $200 (psychological breakout level) |
| Support 1 | $175 (wedge base, Supertrend) |
| Support 2 | $166 / $159 (20/50 EMA cluster) |
| RSI (30-min) | 64.85 (bullish momentum) |
| MACD (30-min) | Strong bullish crossover |
| OBV (4H) | Rising with price |
| Supertrend (4H) | Bullish, support at $175 |
| DMI (4H) | +DI leads, ADX stable |
| Bollinger Bands (1D) | Upper band test at $186.25 |
| EMA Cluster (1D) | Bullish stack, 200 EMA at $139 |
| Derivatives OI | $10.06B (+9.51%), long-heavy bias |
| Options Volume | $3.68M (+143%), speculative inflow |
Disclaimer: The information presented in this article is for informational and educational purposes only. The article does not constitute financial advice or advice of any kind. Coin Edition is not responsible for any losses incurred as a result of the utilization of content, products, or services mentioned. Readers are advised to exercise caution before taking any action related to the company.


 Price Prediction: Canton Eyes Key Break After Market Activity Spike")

