 Price Prediction for July 25")
Solana price today is trading near $182.20, down sharply from the recent peak of $208.60 reached on July 21. After forming a double-cup breakout on the daily chart, Solana price surged aggressively, but this rally has now paused as indicators suggest cooling momentum and bearish divergence on lower timeframes. Buyers are now attempting to defend the dynamic support zone at $181 to $183, a region aligned with the 50 EMA and key breakout retest levels.
What’s Happening With Solana’s Price?
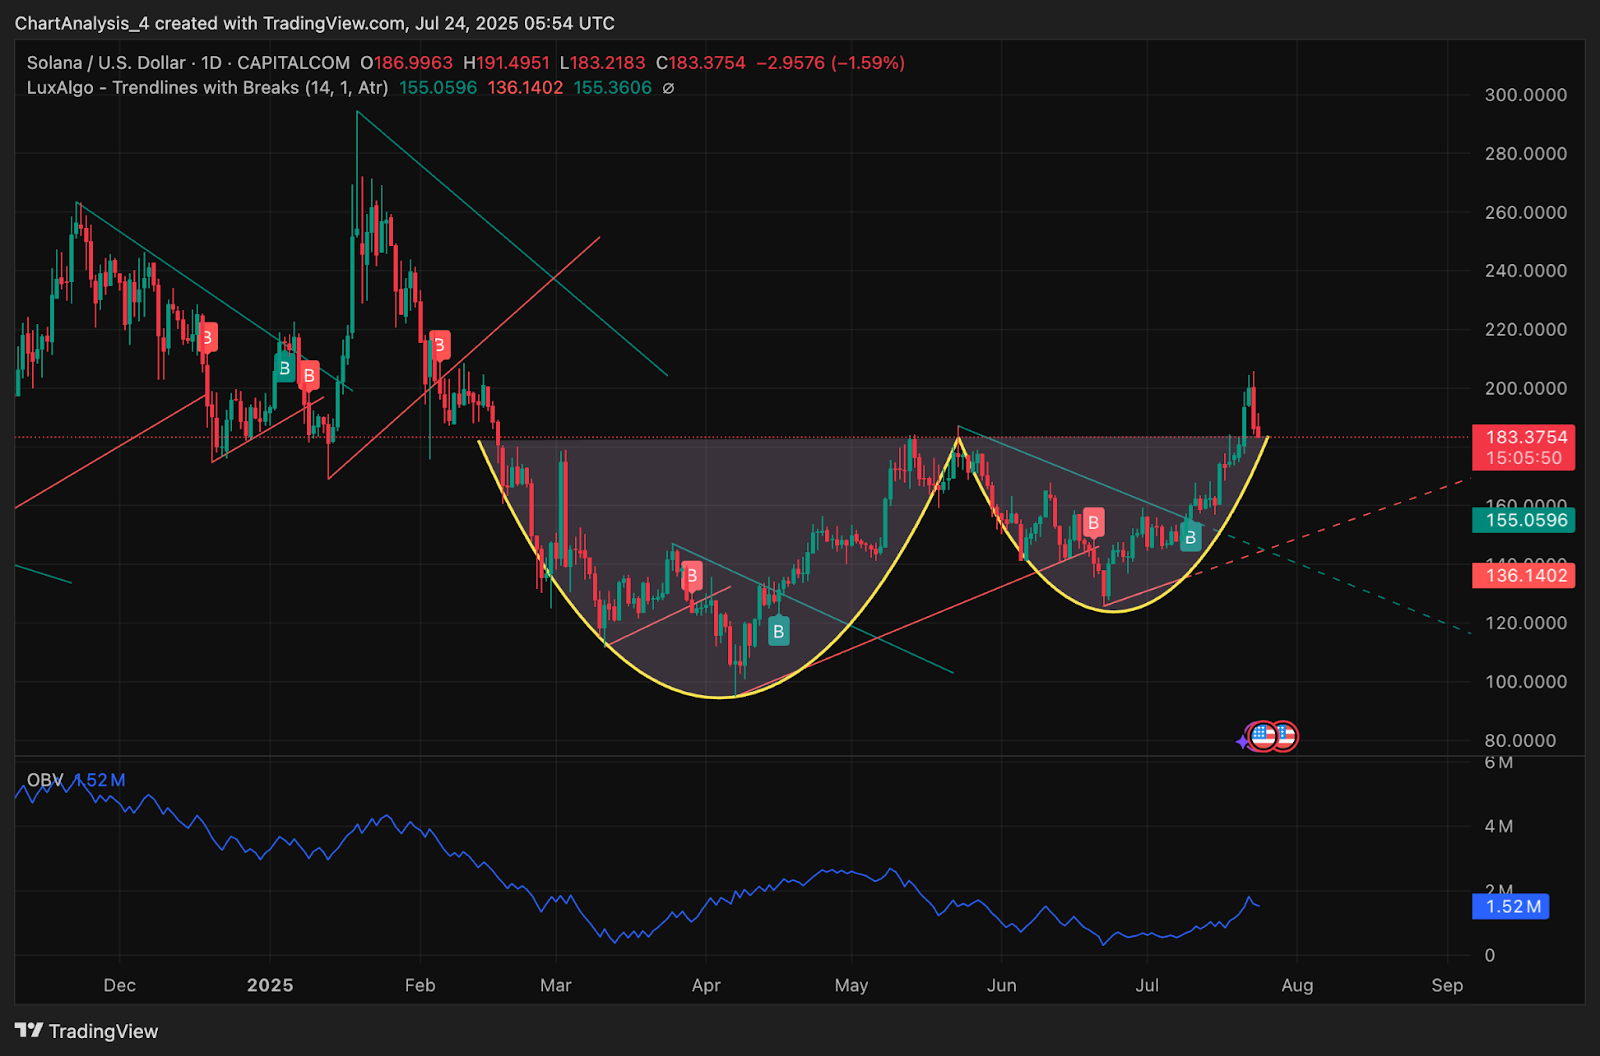
Solana’s recent breakout above the $165 neckline confirmed a large cup and handle pattern, projecting a potential continuation above $200. However, after reaching $208, SOL retraced back into the mid-range of its upward channel on the 4-hour chart.
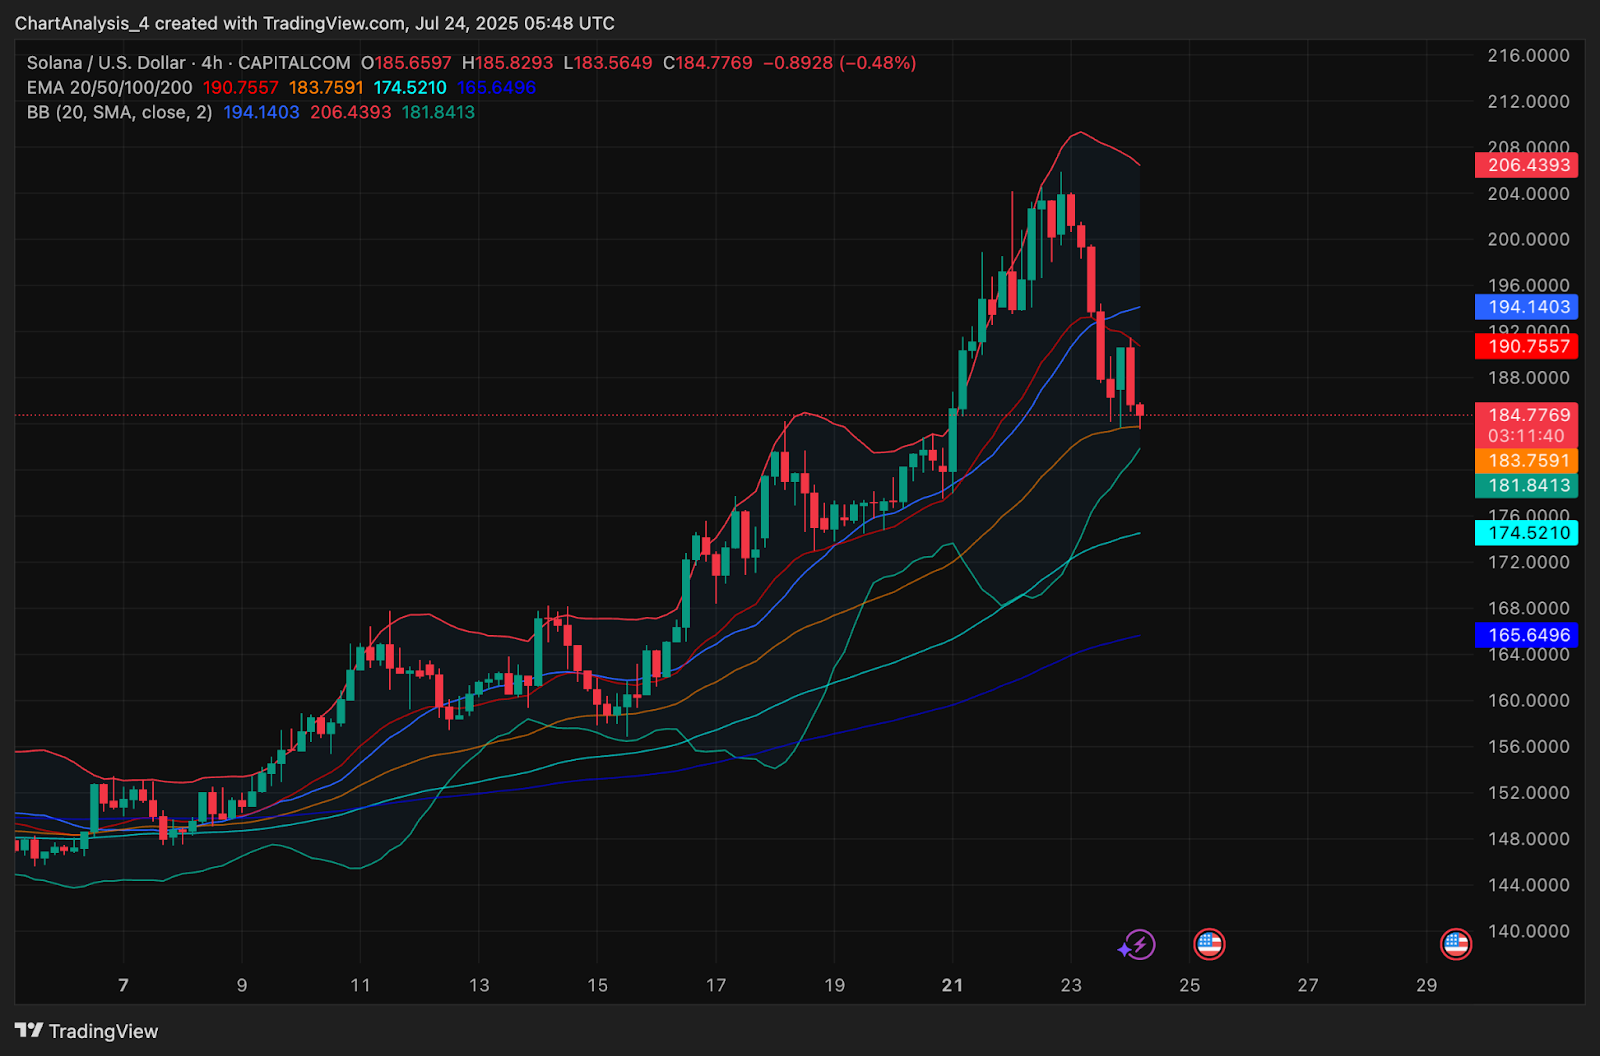
The price is now trading at the lower Bollinger Band while testing the 50 EMA at $183.75. The daily trendline from the breakout structure remains intact, and price is still holding above the Supertrend level of $200.93. However, if the current support breaks down, the next confluence of EMAs lies near $174.52 and $165.64.
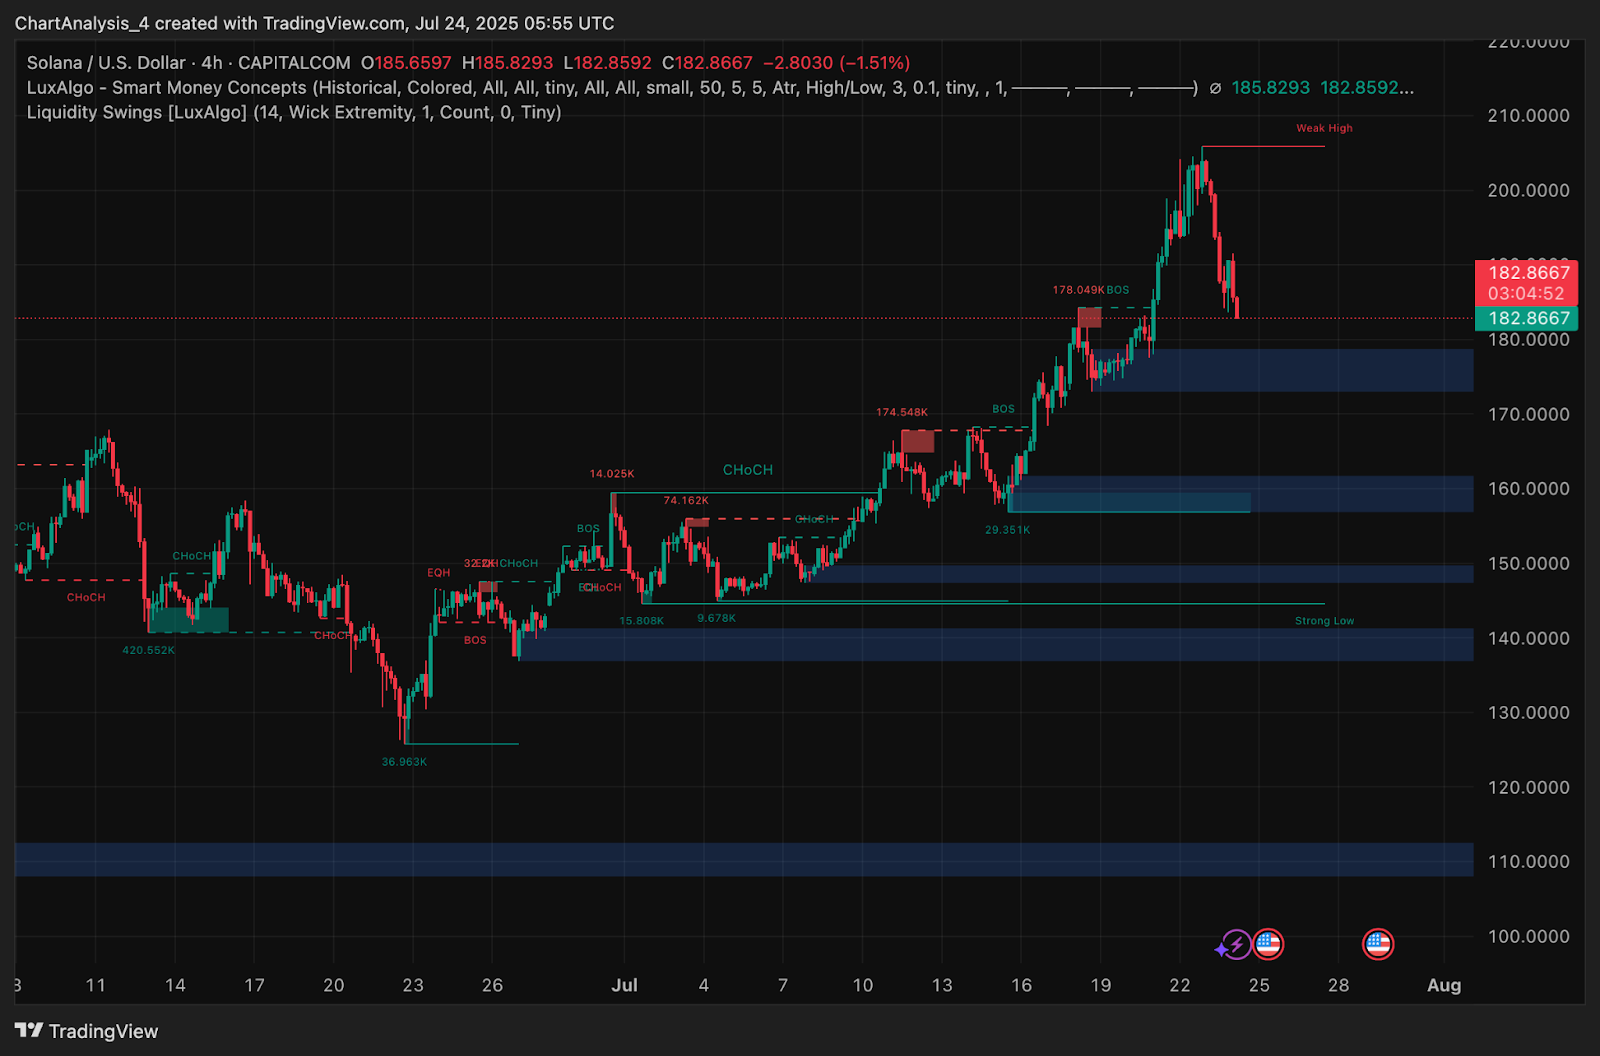
The Smart Money Concepts chart shows that Solana’s rally generated multiple Break of Structure (BOS) signals, but a “Weak High” has now been printed just below the $210 mark. The current corrective move is pulling back into the last liquidity pocket between $178 and $182. This makes the current zone a short-term decision area for bulls.
Why Is The Solana Price Going Down Today?
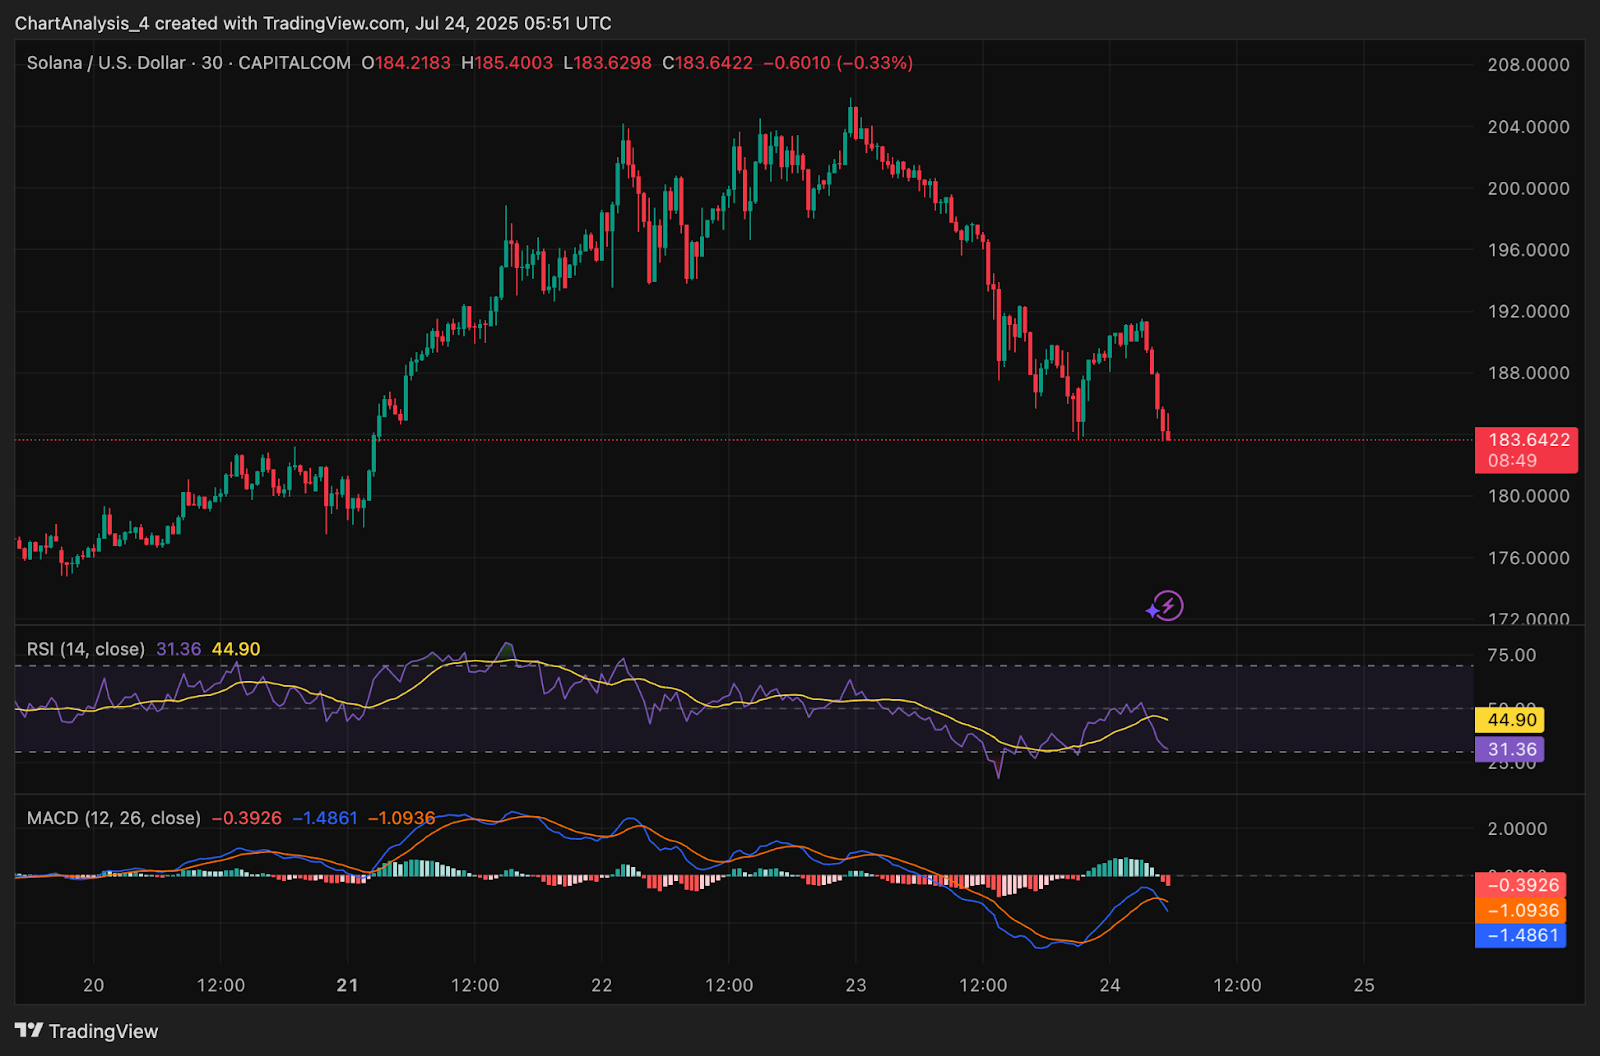
The short-term selloff in Solana price is driven by momentum exhaustion, declining risk appetite, and a net capital outflow across spot markets. The 30-minute RSI is currently at 31.36, showing that SOL has entered an oversold condition. However, this comes after a bearish divergence played out from the July 22 peak, indicating momentum peaked early.
The MACD histogram also turned red and remains bearish on both 30-minute and 4-hour timeframes. The signal line crossover suggests continued bearish control in the short term unless the price breaks back above $190.
On-chain data adds further caution. The latest Coinglass flow tracker shows a sharp net outflow of $58.95M on July 24, indicating profit-taking across major exchanges. This sell-side pressure aligns with the visible drop in price from $200 to sub-$185 zones.
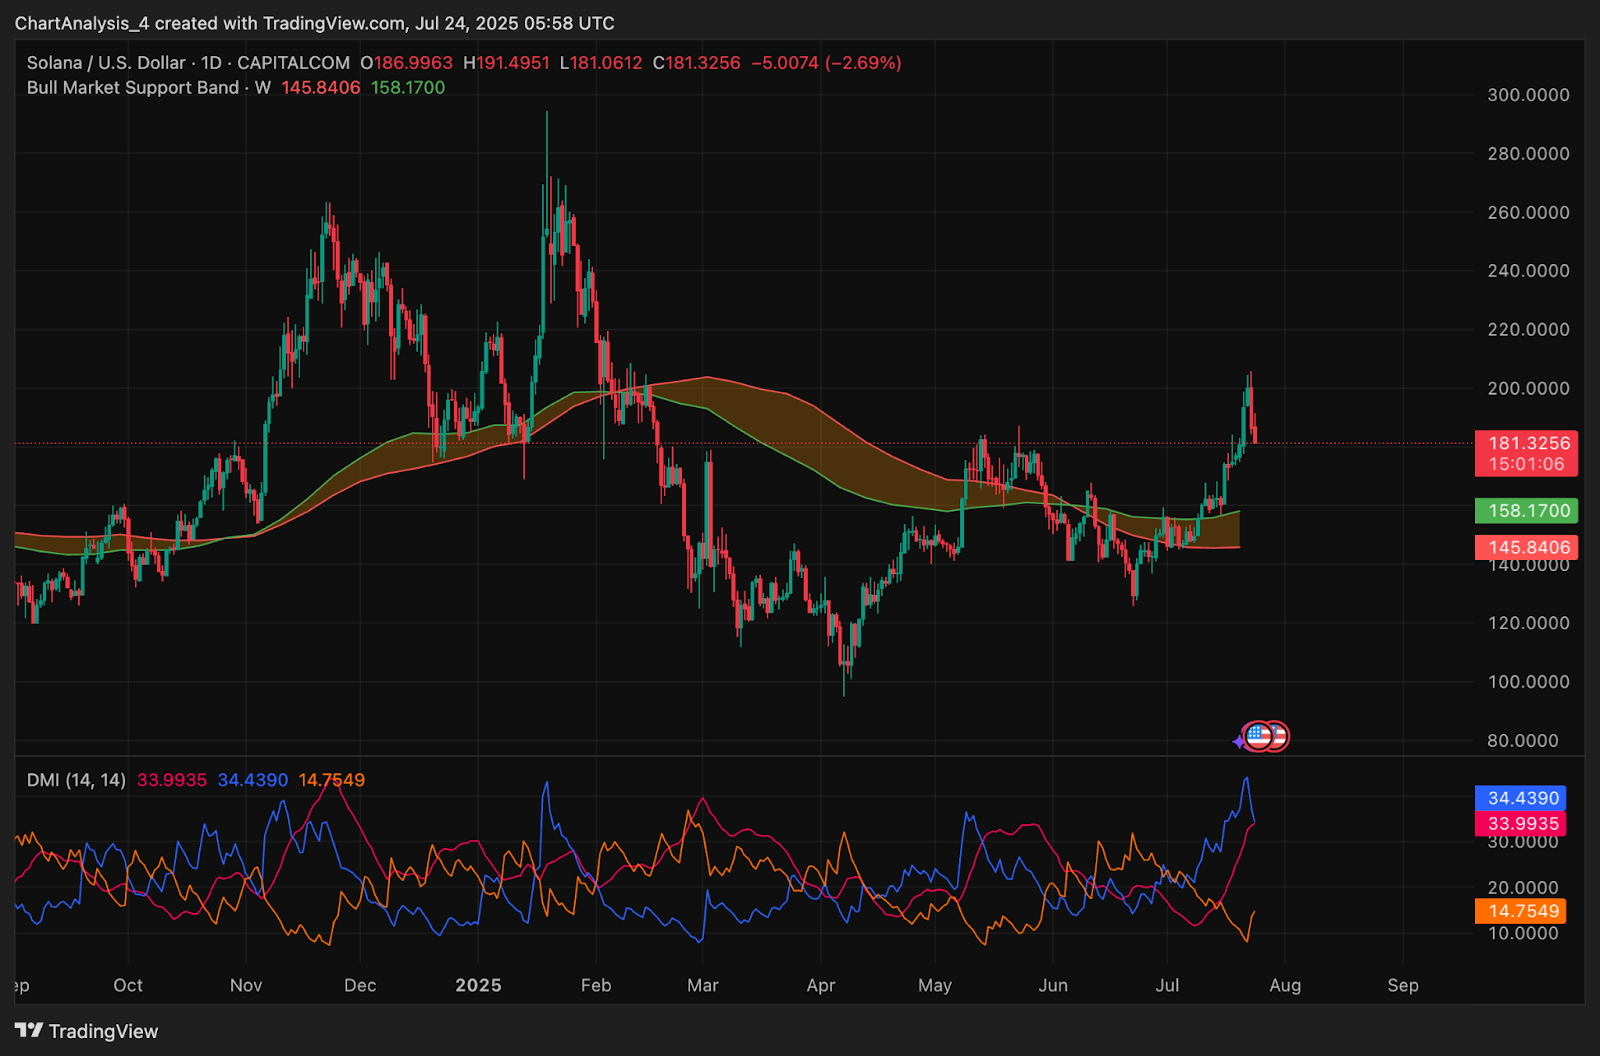
Meanwhile, the DMI on the daily chart reveals a near crossover between +DI (34.43) and -DI (33.99), suggesting fading bullish momentum. The ADX has dropped below 15, implying that the prior trend strength is weakening.
Solana Price Action Tests Key Channel and Cup Breakout Retest
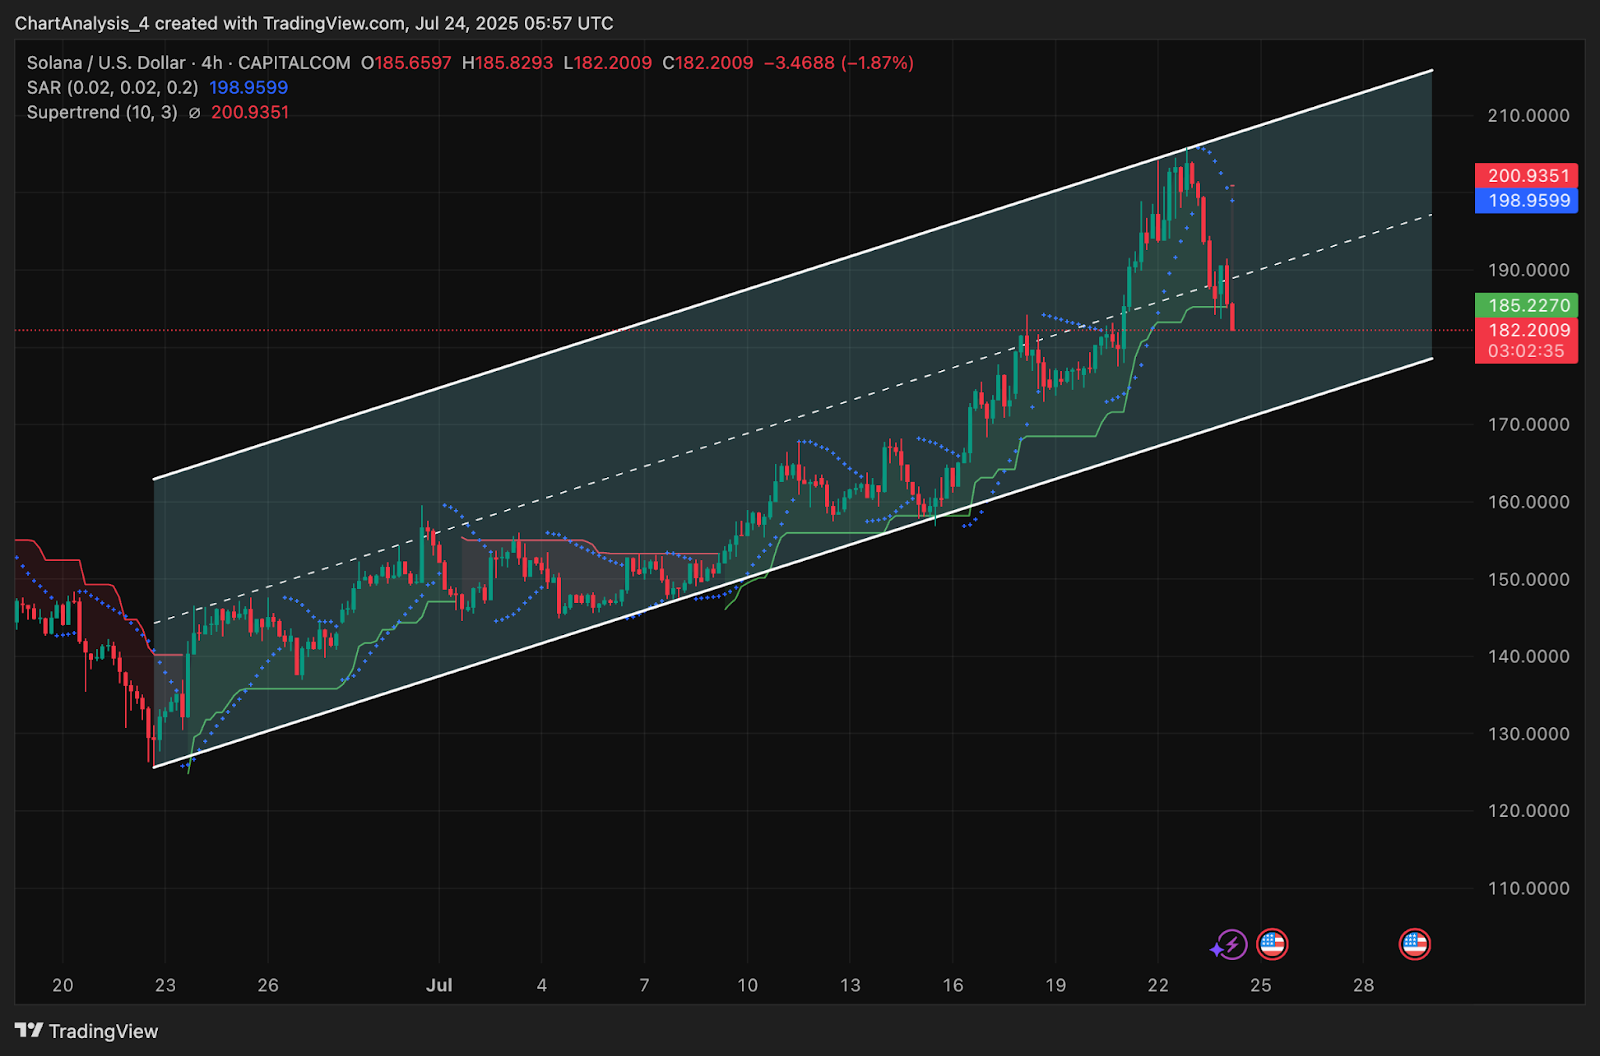
The broader structure still favors bulls, but this pullback is testing an important region. Price is now sitting near the midline of a well-defined ascending channel that began in late June. The lower bound of this channel, currently near $176, may act as final defense before a full retrace of the breakout.
On the daily chart, the neckline breakout from the double-cup formation sits at $165. A deeper retracement toward that level would still preserve the broader bullish structure, but it would signal a full reset of short-term gains.
Bollinger Bands on the 4-hour chart are widening again, indicating increased volatility. The price is pressing against the lower band while riding below the 20 and 50 EMAs. If a bounce occurs from this level, the upside targets would include $190.75, then $196, followed by the $200.93 Supertrend level.
Solana Price Prediction: Short-Term Outlook (24H)
In the next 24 hours, Solana price must hold above the $181 to $183 zone to avoid triggering further downside toward $175. If this support fails, the next high-volume support lies at $165, which also aligns with the daily trendline and neckline breakout level.
A successful bounce from current levels would need to reclaim the $188 to $190 range with strong volume. This would reestablish upward momentum and set the stage for a retest of $200 to $208. Until then, the bias remains corrective with caution advised near key intraday levels.
Market participants should watch RSI recovery, MACD histogram flattening, and whether capital inflow returns in the next session.
Solana Price Forecast Table: July 25, 2025
| Indicator/Zone | Level / Signal |
| Solana price today | $182.20 |
| Resistance 1 | $190.75 |
| Resistance 2 | $200.93 |
| Support 1 | $183.00 |
| Support 2 | $174.52 |
| Daily Neckline Breakout | $165.00 |
| Supertrend (4H) | $200.93 (bearish flip) |
| RSI (30-min) | 31.36 (oversold) |
| MACD (30-min) | Bearish crossover |
| Bollinger Bands (4H) | Price at lower band |
| DMI (Daily) | +DI 34.43, -DI 33.99, ADX weakening |
| Netflow (July 24) | -$58.95M (bearish outflow) |
| Pattern Watch | Double-cup breakout retest |
Disclaimer: The information presented in this article is for informational and educational purposes only. The article does not constitute financial advice or advice of any kind. Coin Edition is not responsible for any losses incurred as a result of the utilization of content, products, or services mentioned. Readers are advised to exercise caution before taking any action related to the company.


 Price Prediction: Canton Eyes Key Break After Market Activity Spike")

