 Price Prediction for June 20, 2025")
The Solana price today is trading near $145.30, down over 0.9% in the last 24 hours, as sellers continue to pressure the asset below multiple key EMAs. SOL has returned to a major demand zone near $144.50–$140.80 after failing to hold above $150, and bears appear to be tightening their grip. The rejection from $158 resistance earlier this week was followed by a steady bleed into lower price territory, reflecting weakening bullish conviction.
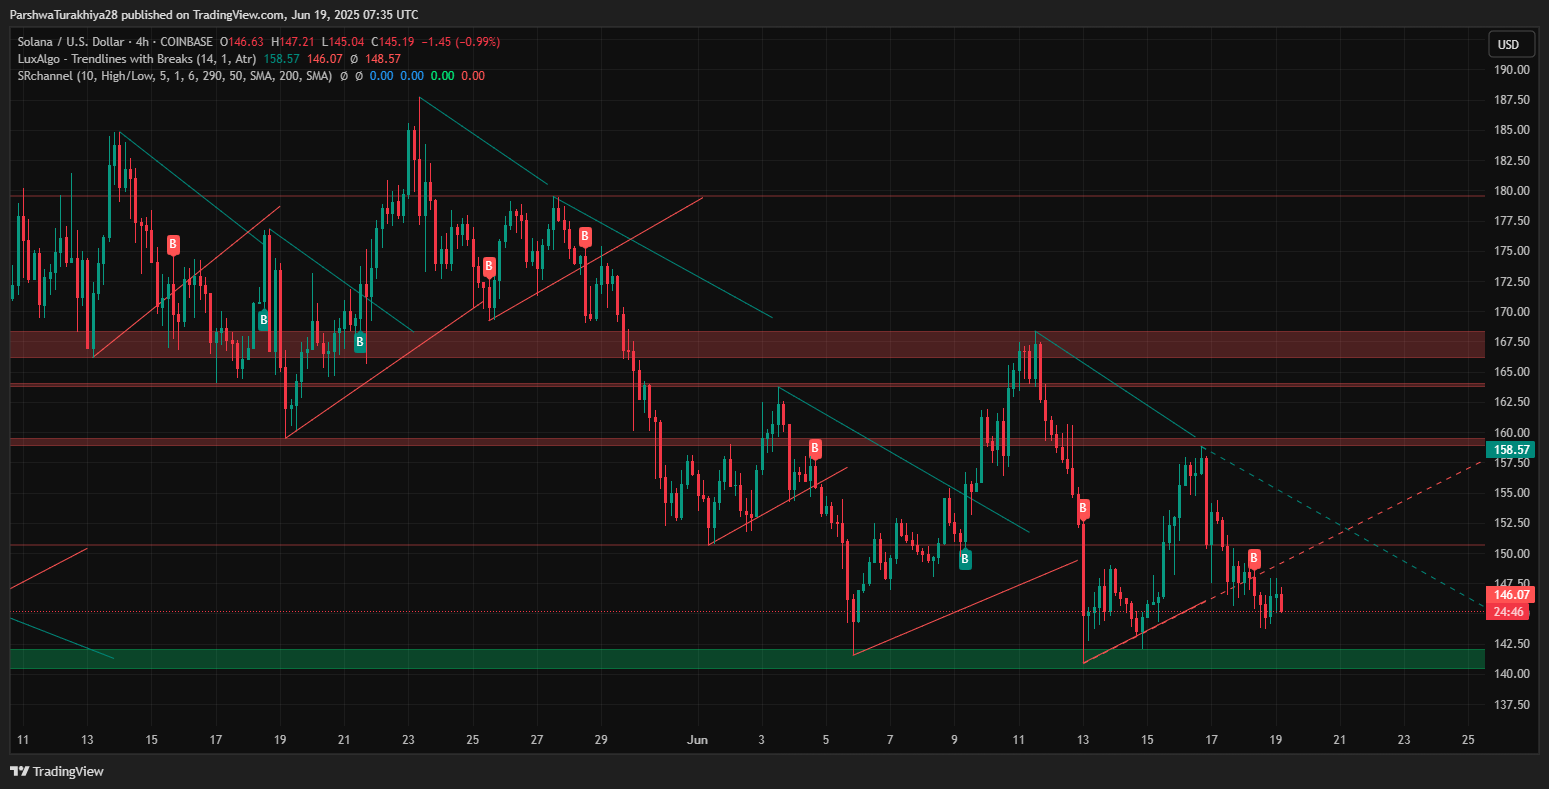
Current Solana price action suggests another breakdown test may be imminent, as price consolidates near a structural support low from early June. With market-wide uncertainty and compression evident, traders are closely watching for confirmation of a breakout or breakdown.
What’s Happening With Solana’s Price?
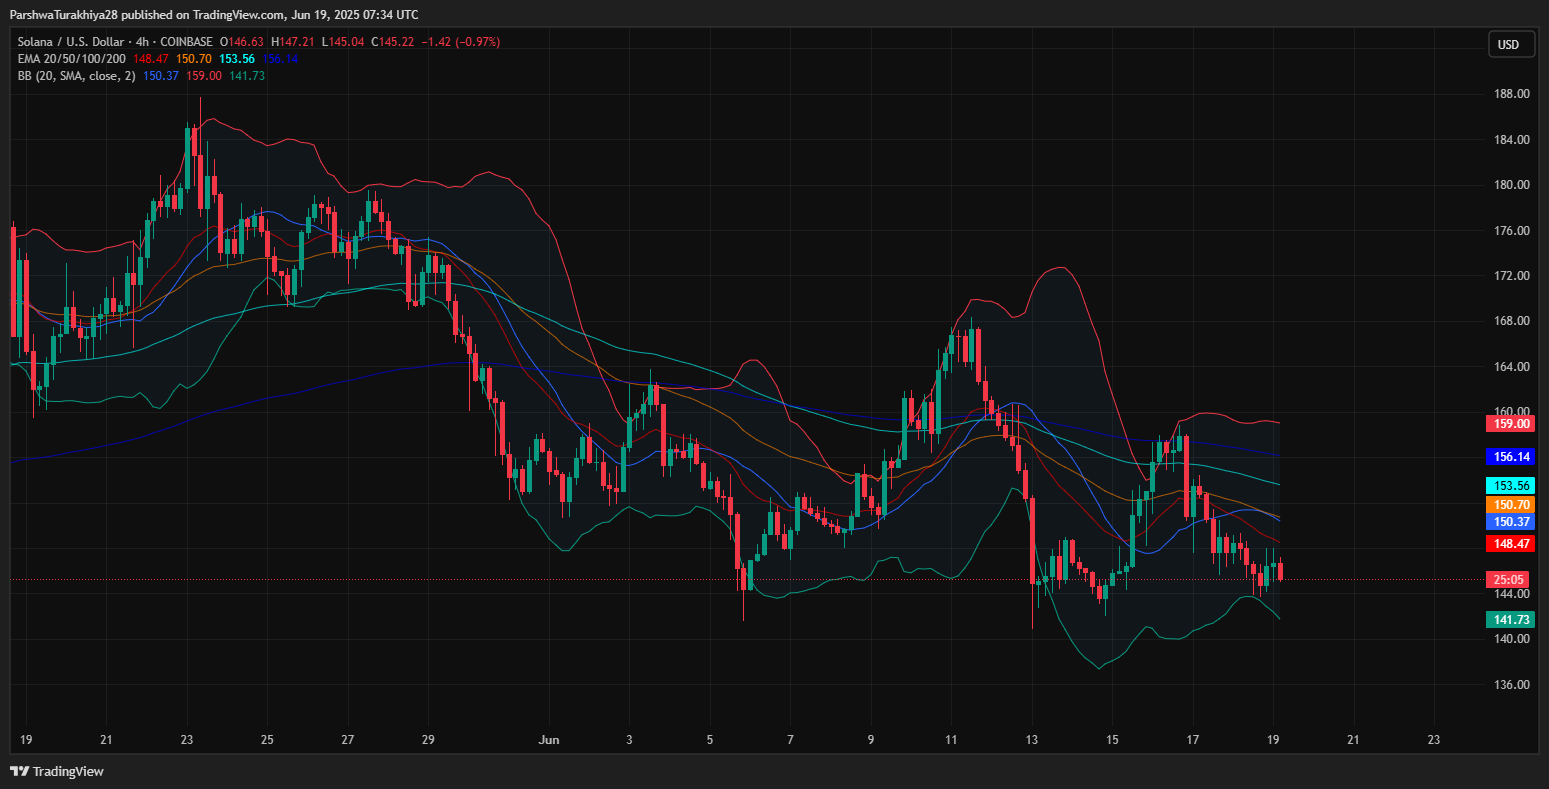
The current short-term structure shows SOL continuing to trade beneath its 20/50/100/200 EMA cluster, now converging between $148.5 and $156.1. The latest 4-hour candle shows compression below this resistance band, with price pinned near the midline of the Bollinger Bands, and lower Keltner Channels narrowing around $141.70.
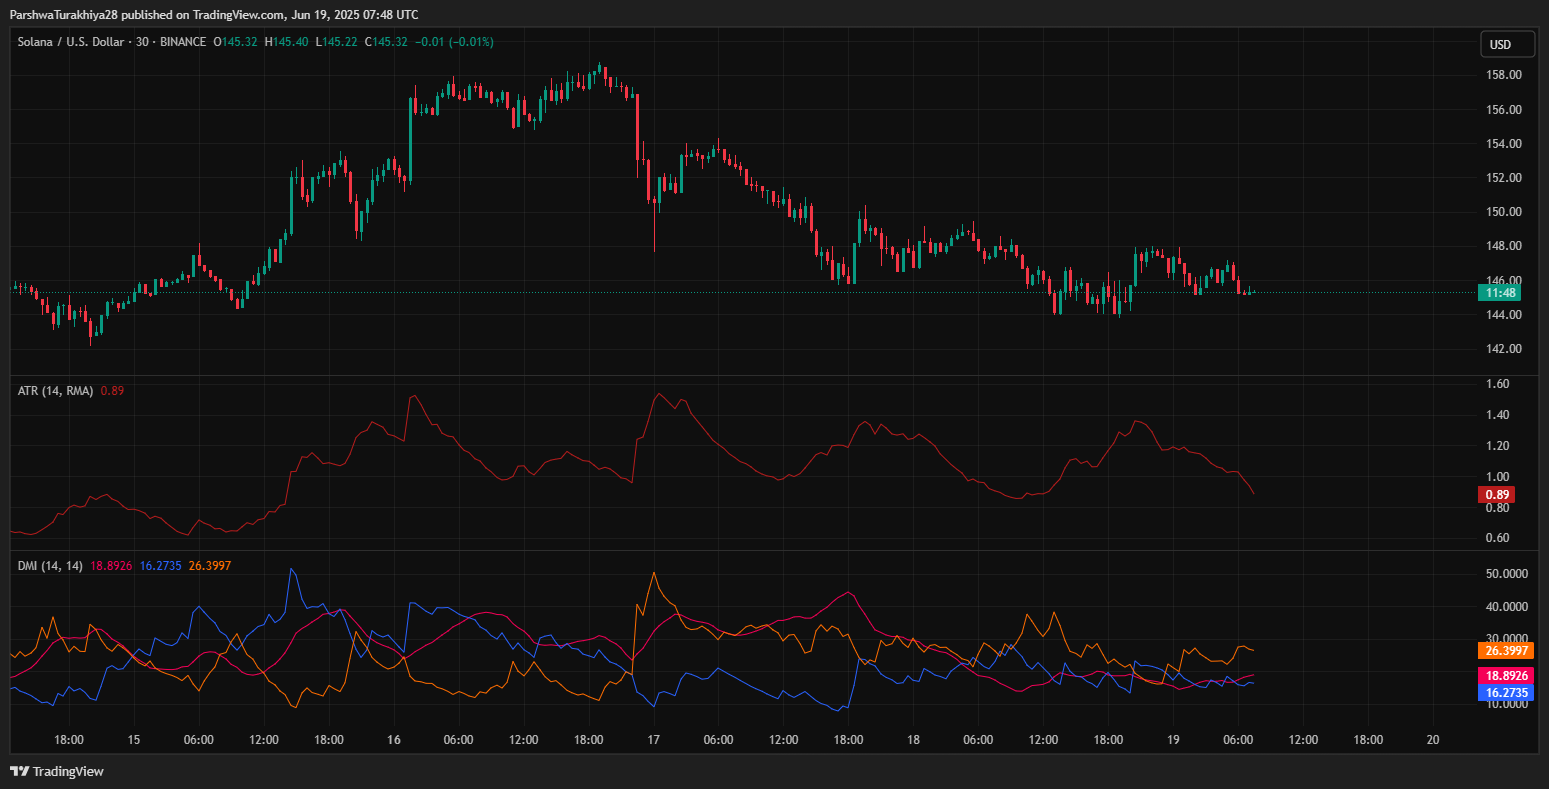
This flattening structure is echoed by the Average True Range (ATR), which has dropped to 0.89, indicating declining Solana price volatility. Meanwhile, directional indicators reflect growing bearish dominance: the 30-minute MACD has turned flat to negative (-0.12), and RSI sits at 44.08 with no signs of divergence, keeping momentum weak.
Why Solana (SOL) Price Going Down Today?
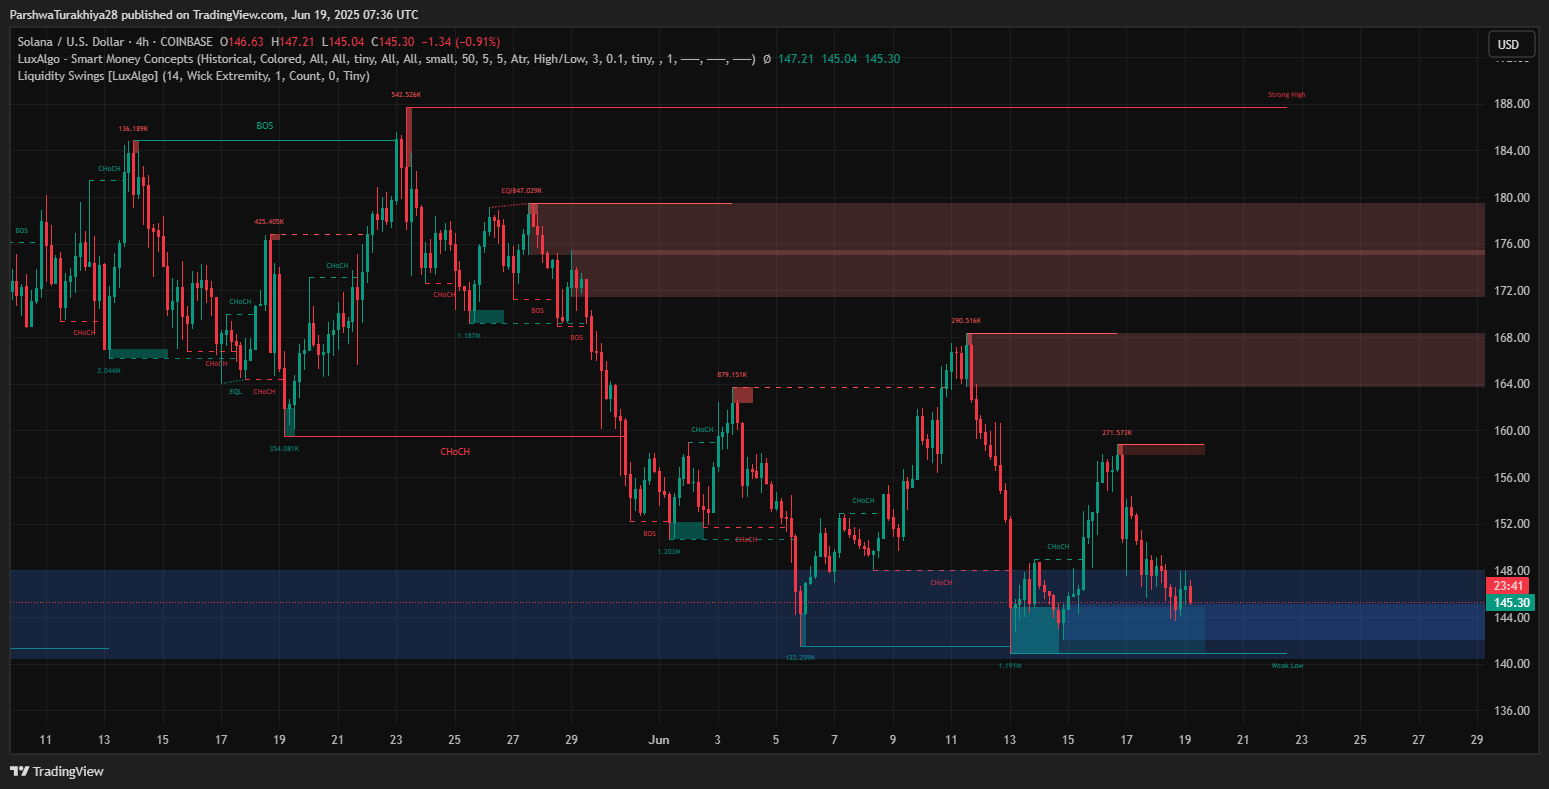
One key reason why Solana price going down today is the breakdown in smart money structure. Price failed to hold above the previous CHoCH (Change of Character) zones near $153–$156 and instead reversed from a premium order block. The most recent liquidity sweep near $158 was followed by bearish market structure shifts, pulling price back into the demand zone.
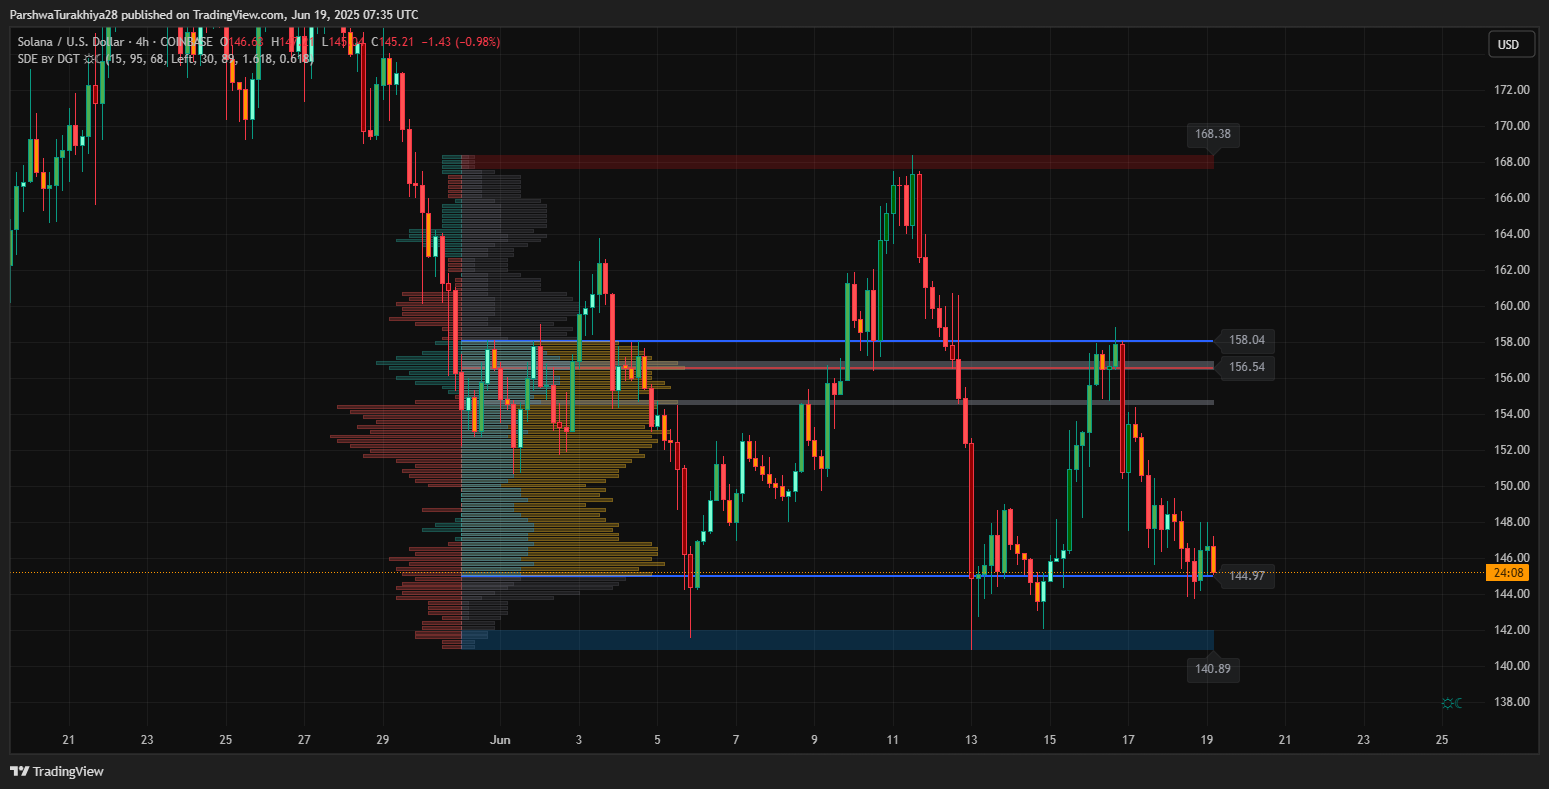
Volume profile analysis further supports this weakness. The visible range shows a low-volume node between $147 and $149, which has now turned into resistance. Price has been rejected multiple times from this zone, reflecting poor buyer absorption.
Adding to bearish bias, the Bull Bear Power (BBP) is trending negative again and the current price remains well below the bull market support band, which sits at $150.70–$159. This indicates broader structural fragility. Meanwhile, the Chaikin Money Flow (CMF) remains stagnant, failing to confirm any fresh bullish inflows.
Short-Term Outlook: Solana Needs to Hold $143 or Risk Further Drop
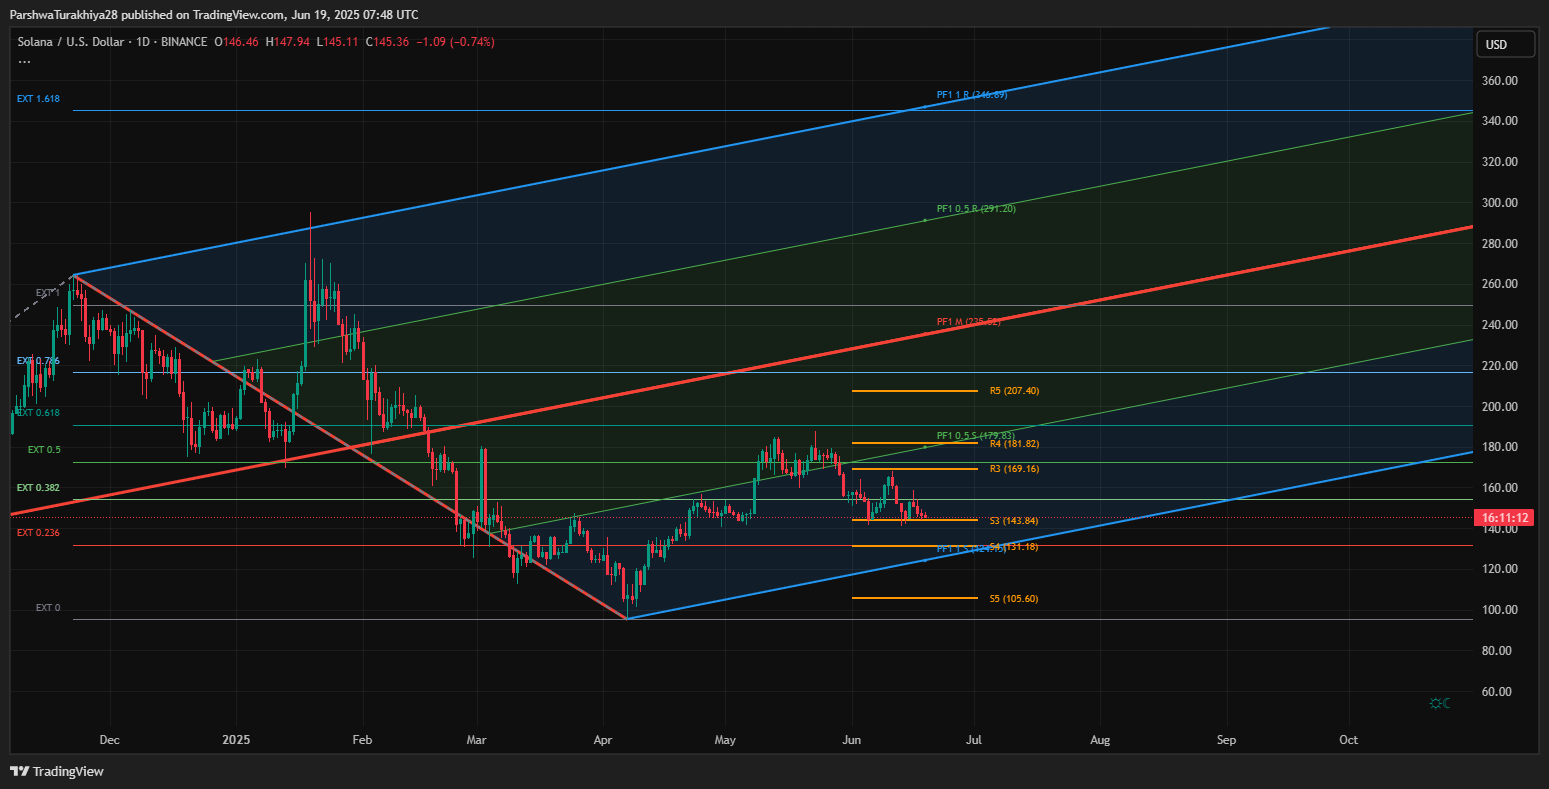
Solana’s current positioning within the broader pitchfork channel points to a critical inflection zone. The lower boundary support near $143.84 (S3 level) is being retested. A failure to hold this level may accelerate downside toward $140.89, which is the final major demand block before a possible flush toward the 1.618 extension near $131.18.
However, if bulls manage to defend this zone, a bounce toward the R1 pivot at $148.47 is possible. A clean break above $153.56 (EMA50) would then open the path to $156.54–$158.04, the zone where breakdown originated. Only a strong close above this cluster can reignite Solana price spikes in the short term.
From a macro view, the daily chart shows SOL still respecting a long-term ascending pitchfork from late 2024. But a break below the midline here could alter trend trajectory and expose deeper corrections.
Solana (SOL) Price Forecast Table: June 20, 2025
| Indicator/Zone | Level (USD) | Signal |
| Resistance 1 (R1 Pivot) | 148.47 | Intraday resistance |
| Resistance 2 (EMA Cluster) | 153.56–156.14 | Compression zone resistance |
| Resistance 3 (Breakdown origin) | 158.04 | Short-term top zone |
| Support 1 (Demand Block) | 144.50–143.84 | Critical holding range |
| Support 2 (Low Volume Node) | 140.89 | Breakdown trigger |
| Support 3 (Fib EXT 1.618) | 131.18 | Worst-case downside target |
| EMA 20/50/100/200 Avg | 148.47–156.14 | Dynamic resistance cluster |
| RSI (30-min) | 44.08 | Bearish-neutral momentum |
| MACD | -0.12 | Weak momentum bias |
| ATR (14) | 0.89 | Low volatility environment |
| CMF | Flat | No significant inflow |
| BBP | Negative | Bearish pressure building |
Unless SOL bulls can reclaim and hold above $148.47 in the coming sessions, the risk of further downside remains elevated. The broader market remains cautious, and Solana price may continue facing selling pressure if Bitcoin and Ethereum fail to regain their key support levels. All eyes are now on the $143–$140 zone to determine whether buyers can step in before further breakdowns unfold.
Disclaimer: The information presented in this article is for informational and educational purposes only. The article does not constitute financial advice or advice of any kind. Coin Edition is not responsible for any losses incurred as a result of the utilization of content, products, or services mentioned. Readers are advised to exercise caution before taking any action related to the company.


