 Price Prediction For June 24 2025")
The Solana price today is trading near $134.20, recovering from a recent pullback that tested lower demand zones near $124. While short-term momentum has improved, buyers are still grappling with major resistance bands overhead, making the near-term trend fragile.
Although bulls are showing renewed strength, broader conditions suggest that Solana price action remains at an inflection point, especially as volatility appears ready to expand around critical levels.
What’s Happening With Solana’s Price?
The Solana price on June 24 trades around $134.20, recovering after a liquidity sweep toward $124.08 earlier in the week. This bounce aligns with a local demand zone identified on the lower timeframes, supported by multiple bullish signals including recent fair value gaps and trendline defense.
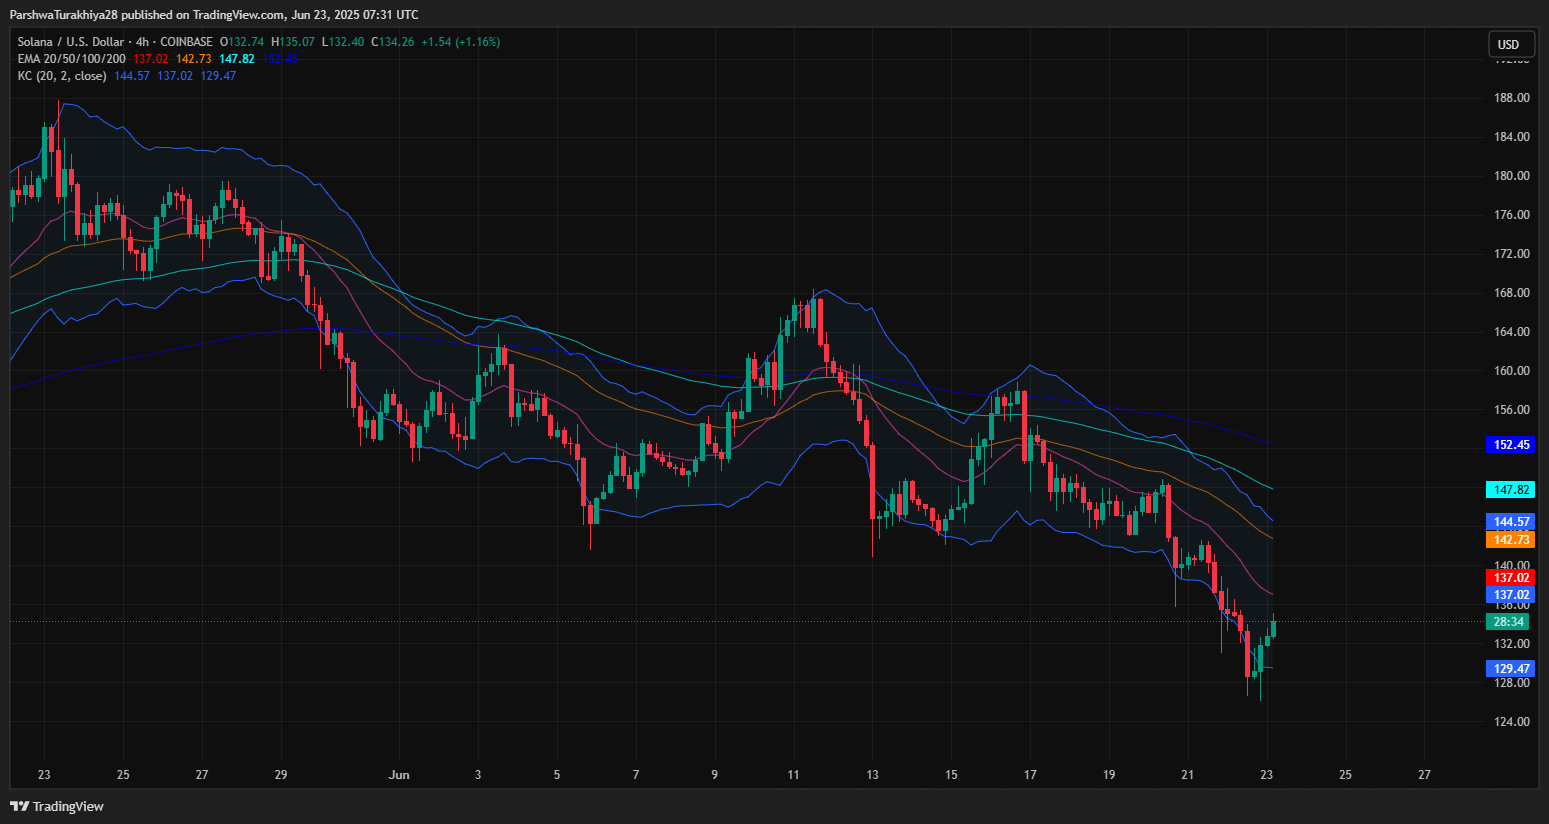
The 4-hour chart shows resistance from the 20/50/100/200 EMA cluster, with immediate pressure near $136 and higher caps near $151. A rejection here would confirm a broader consolidation zone, while a clean break above $138 could trigger renewed upside momentum.
Bollinger Keltner channels are compressing, hinting at possible Solana price volatility in the coming sessions. Support zones are being held around $128 and $124, while short-term liquidity remains concentrated between $138–$144.
Solana Price: Intraday Recovery Meets Clustered Resistance
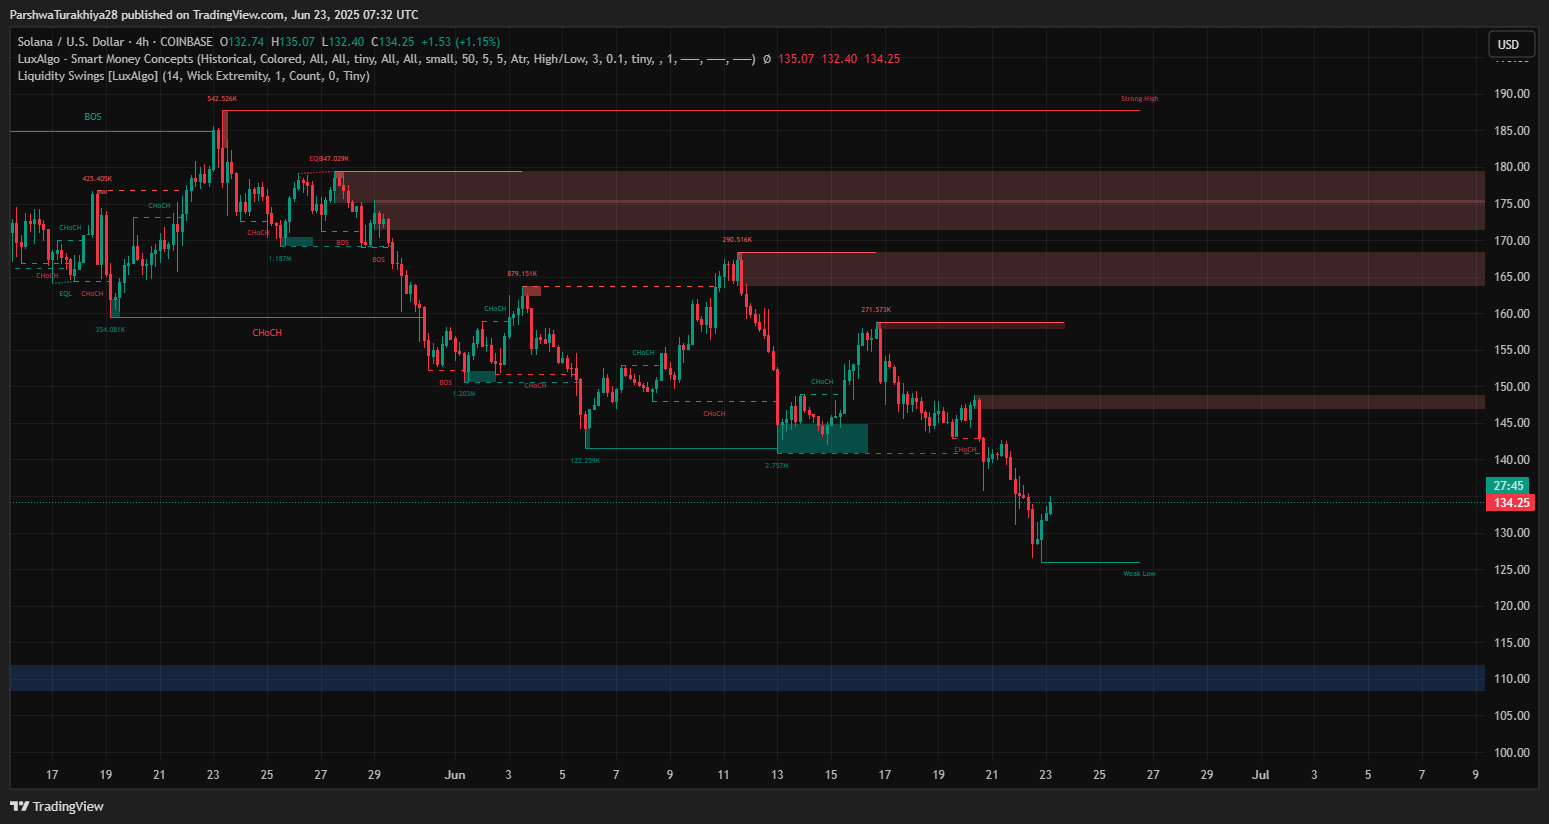
The 4-hour timeframe shows a clearer picture of Solana price volatility, especially the recent CHoCH (Change of Character) near $132.40, which aligned with a demand imbalance zone. From the LuxAlgo SMC charts you shared, we can see BOS (Break of Structure) confirmation below $134.50, with significant liquidity sweeps around $128–$130. This liquidity grab has helped fuel the bounce.
However, the current resistance band between $135.50 and $138.80—marked by previous EQHs and institutional supply blocks—is a red flag. The price must decisively close above these levels with supporting volume to confirm trend reversal. Until then, this rally could turn into a local Solana price spike fading back toward the mid-$120s.
SOL Price Prediction: Short-Term Momentum And Key Resistance Zones
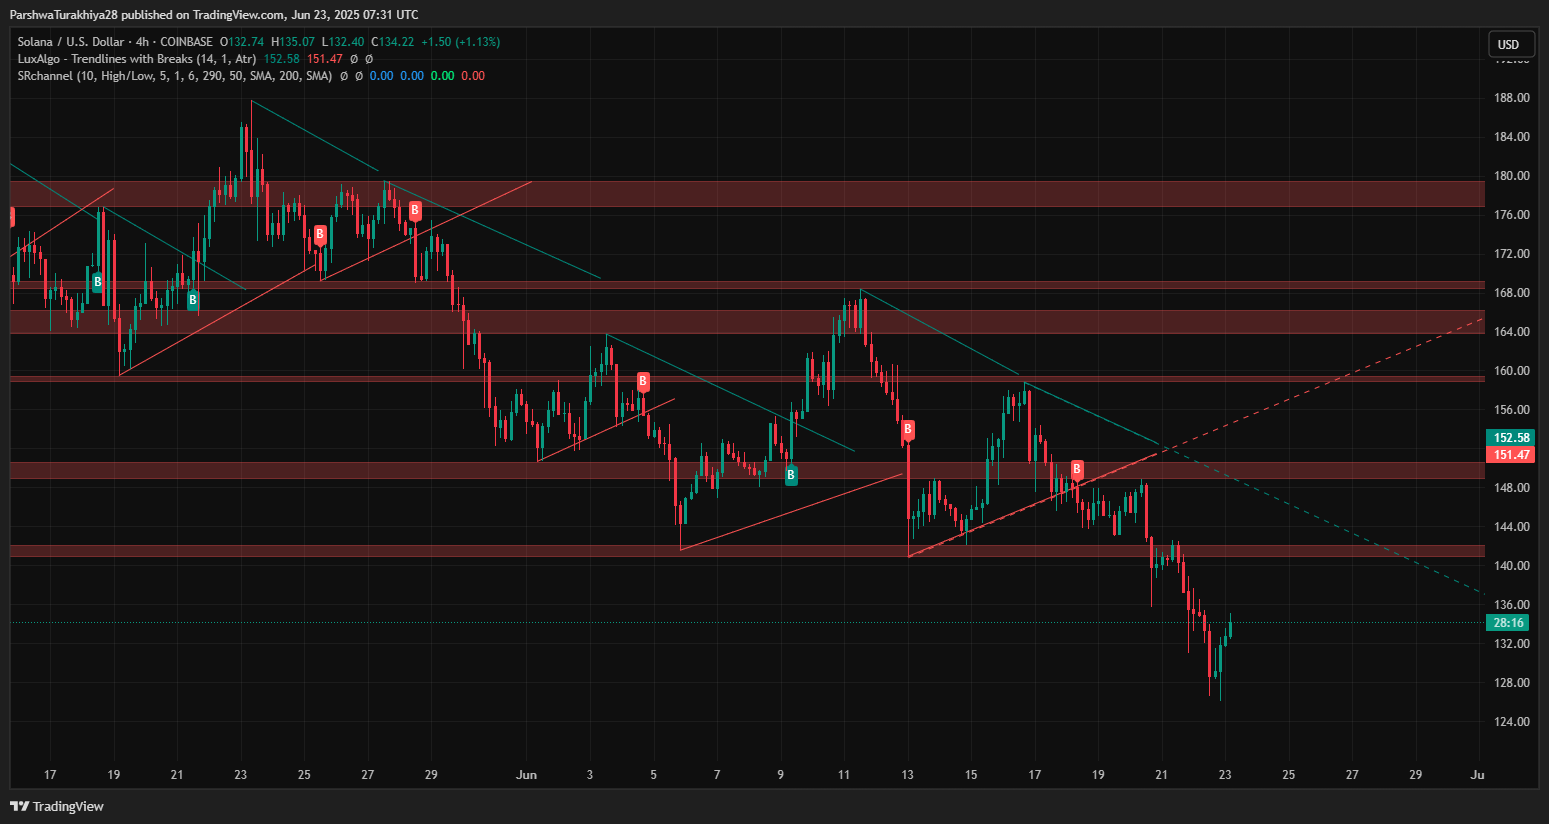
The current structure on the 4-hour chart shows a series of trendline-based rejections around $135–$137, with buy-side inefficiencies unfilled near $145. If bulls manage to flip $138 into support, the next upside targets lie at $144 and then $151.50.
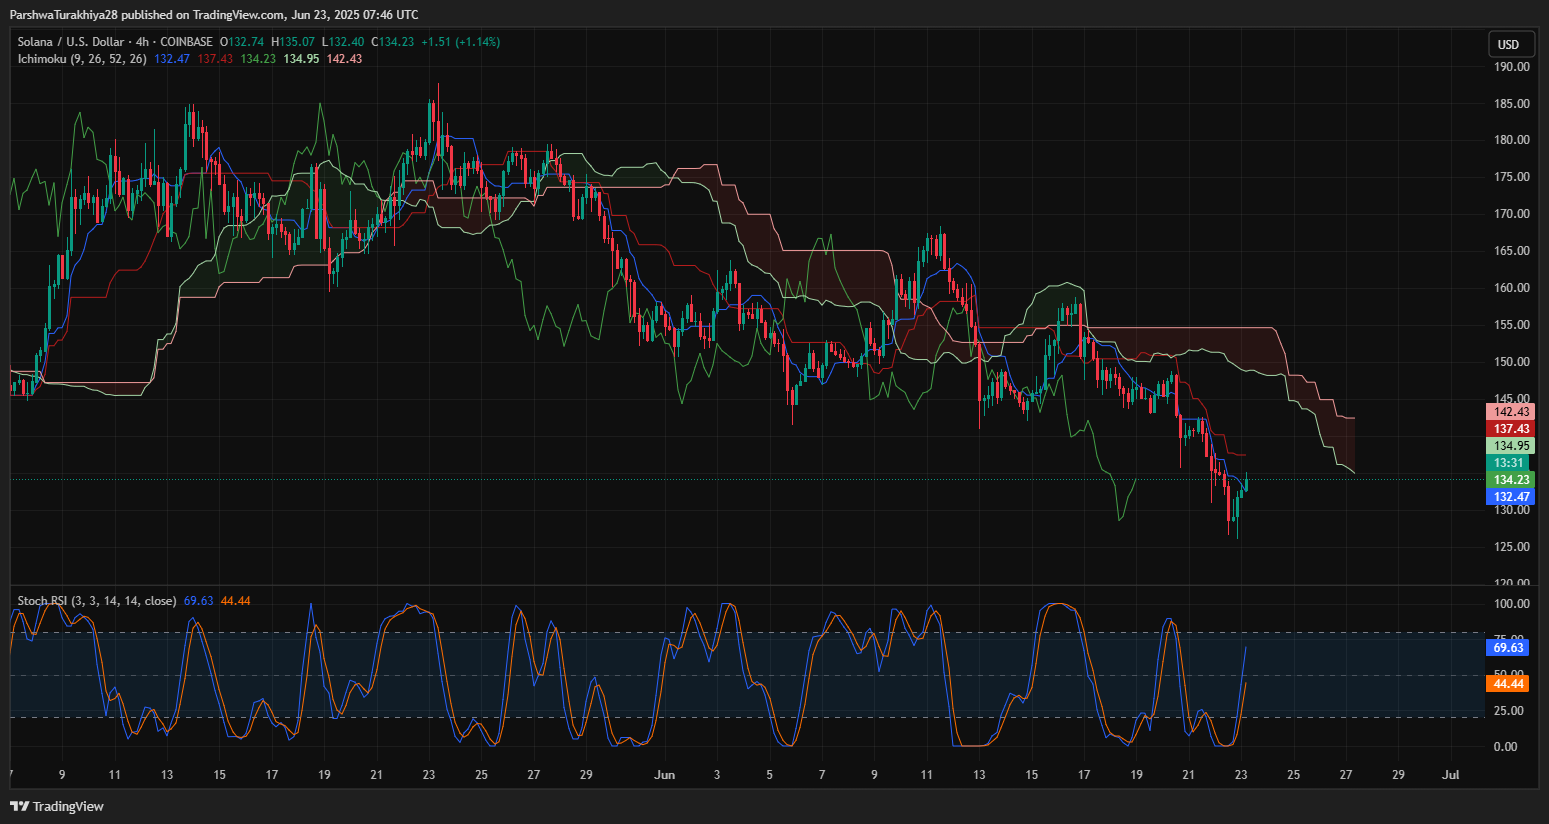
Ichimoku indicators show the cloud resisting price around $134.95 (Kijun), with a flat Span A near $142 acting as a magnet. RSI momentum remains balanced for now, and the SAR flips bullish above $133.38.
The Solana price update shows strong bounce attempts, but without a clean sweep of $138 and confirmed higher highs, momentum remains uncertain.
Why Solana Price Going Up Today?
The latest upside is driven by a sweep of sell-side liquidity below $125, triggering short-term accumulation. This area aligns with both a previous trendline touch and a Fib retracement zone, providing bulls with a key defensive point.
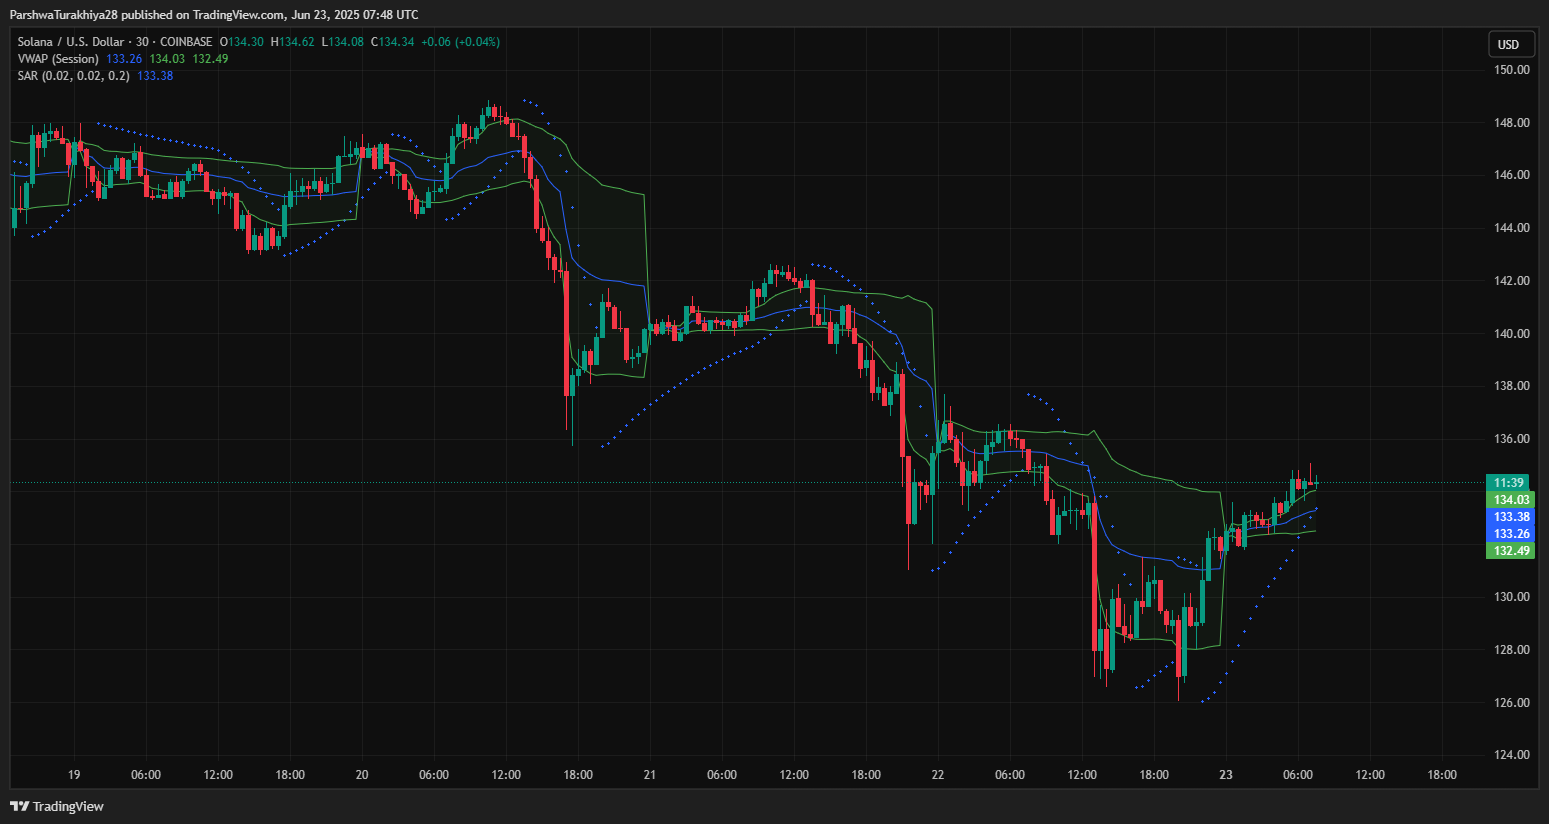
VWAP from the 30-minute chart indicates real-time trading bias has shifted above intraday average at $129.25, with SAR flipping to bullish support at $133.38. These suggest that the current bounce may still extend toward $138 if no new supply zone is triggered.
Solana Price Faces Resistance at $143 After Bouncing From $131 Support
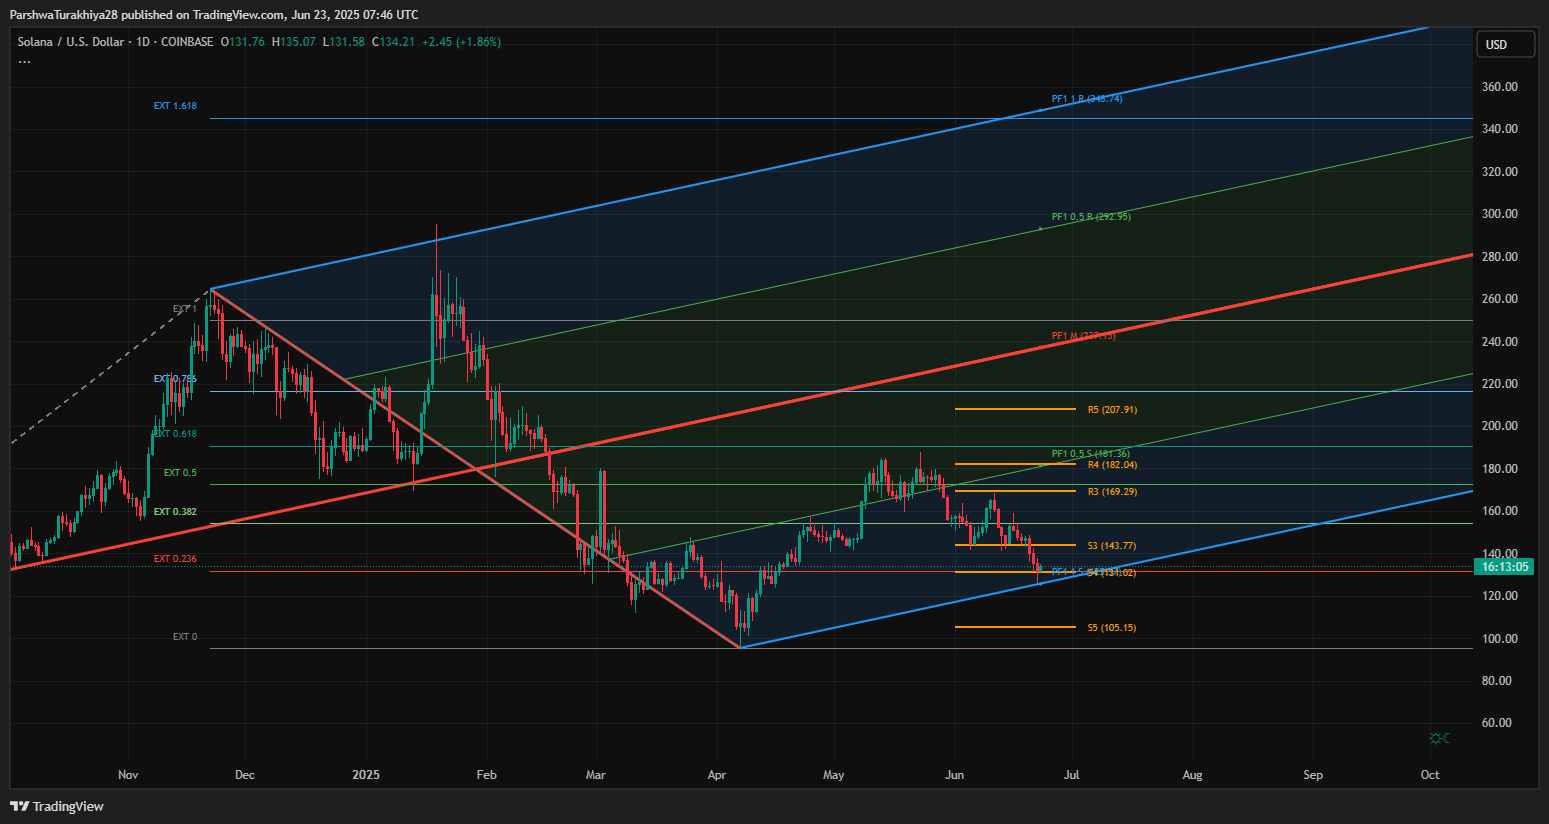
Solana price is showing signs of short-term exhaustion after bouncing from $131, near the lower boundary of its long-term upward channel and key 0.236 Fibonacci support. The rebound remains capped under the $143.77 resistance and lacks volume strength, with broader structure still fragile below $157.
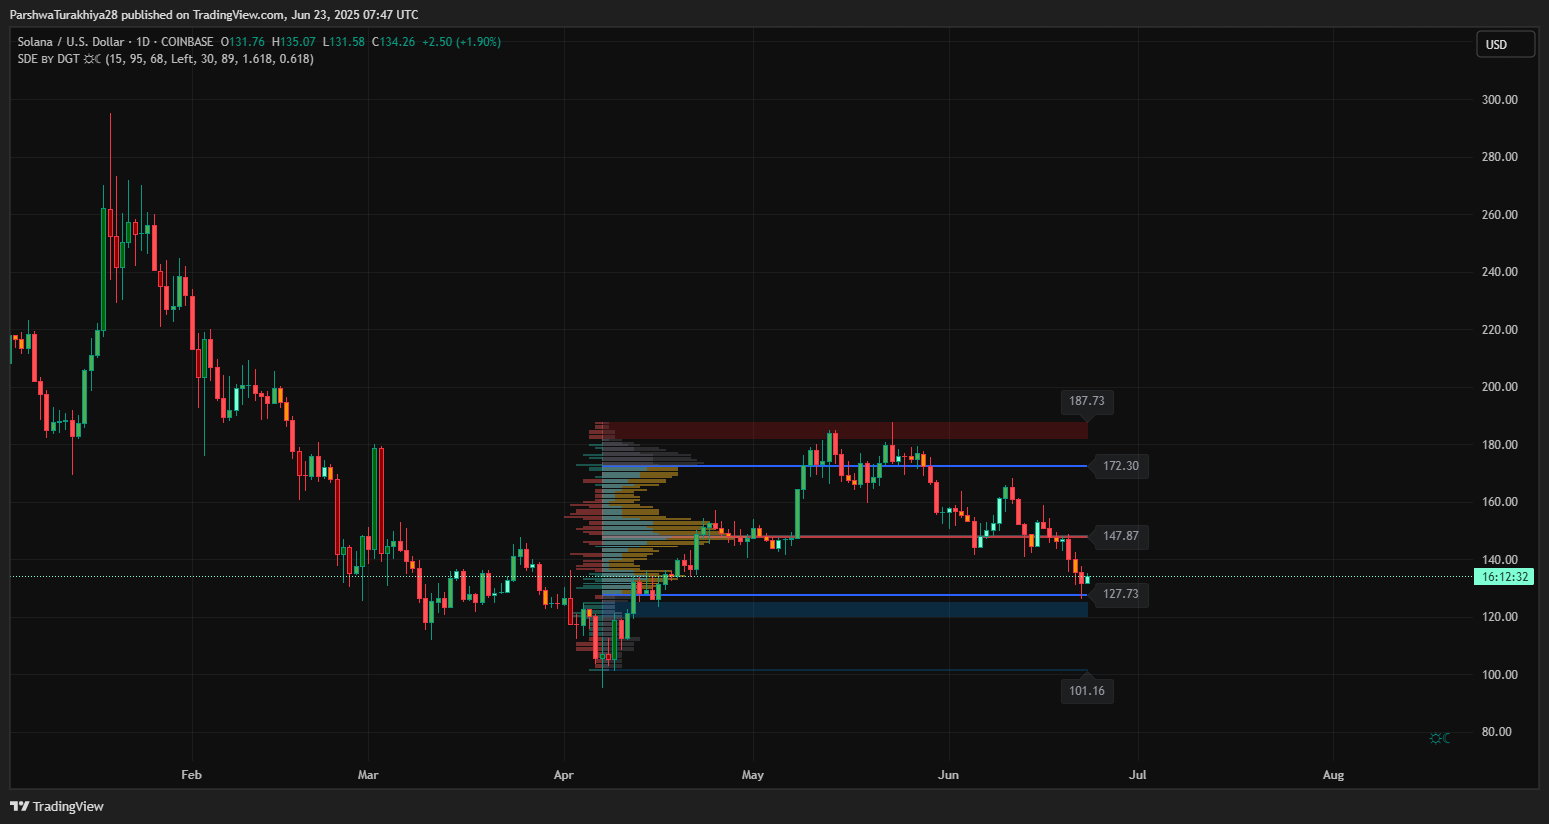
Volume profile shows a strong liquidity base at $127–$130 that absorbed recent selling, while resistance between $147.87 and $172.30 remains untouched since mid-June.
Options Flow And Market Positioning
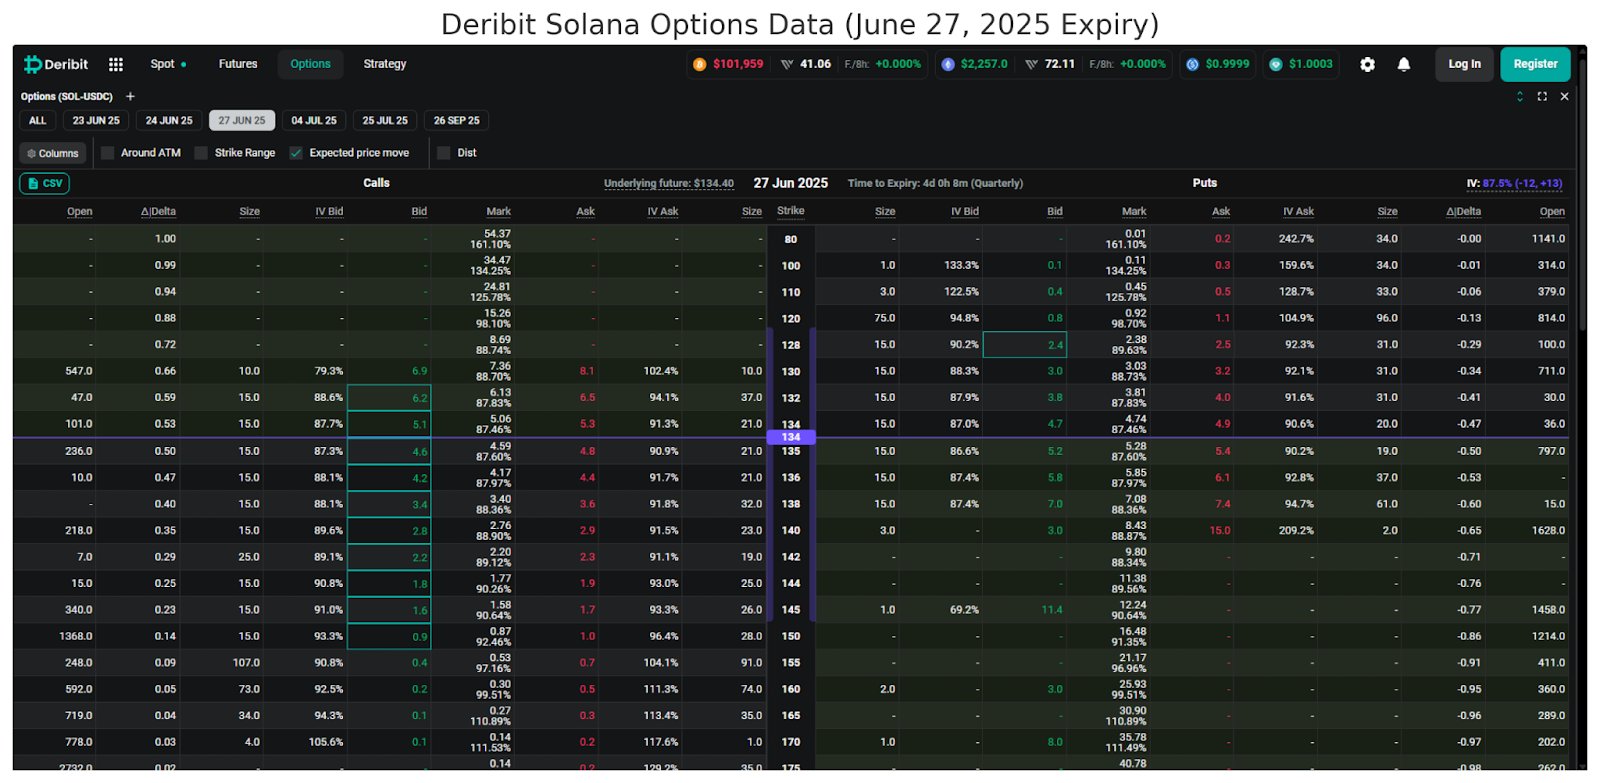
According to Deribit’s SOL options data for the June 27 expiry, open interest is heavily stacked near the $135 and $140 strike calls, with a noticeable bid-ask build-up between $134 and $145. Notably, the $135 call has 21 contracts open with a bid of 5.2 and IV near 86.6%, while the $134 call has high open interest and delta exposure.
On the put side, premiums remain elevated, with IV skew showing higher demand for downside protection around the $130 and $125 strikes. The total implied volatility averages 87.5%, reflecting expectations for a breakout or sharp directional move before expiry.
This Solana price prediction sentiment in the options market suggests traders are hedging for both breakout and breakdown, with a slight tilt toward bullish plays if $135 is breached.
Solana Price Prediction Summary
| Timeframe | Bias | Key Resistance | Key Support | Indicators |
| 30-Minute | Bullish Bias | $136.00 / $138.00 | $129.00 / $124.00 | VWAP, SAR, Bollinger Squeeze |
| 4-Hour | Neutral-Bullish | $144.00 / $151.50 | $132.40 / $128.00 | EMA Cluster, Liquidity Sweep, Trendline |
| 1-Day | Reversal Watch | $157.70 / $162.00 | $121.00 / $115.00 | Fib 0.618, Ichimoku, SMC Zones |
Disclaimer: The information presented in this article is for informational and educational purposes only. The article does not constitute financial advice or advice of any kind. Coin Edition is not responsible for any losses incurred as a result of the utilization of content, products, or services mentioned. Readers are advised to exercise caution before taking any action related to the company.


