 Price Prediction For June 26")
After recovering from lows near $126, the Solana price today is consolidating around $146. The short-term momentum has turned bullish, but SOL is approaching a crucial resistance zone between $146.75 and $151. With volatility compressing and major EMAs aligning overhead, traders are closely watching for a breakout confirmation.
What’s Happening With Solana’s Price?
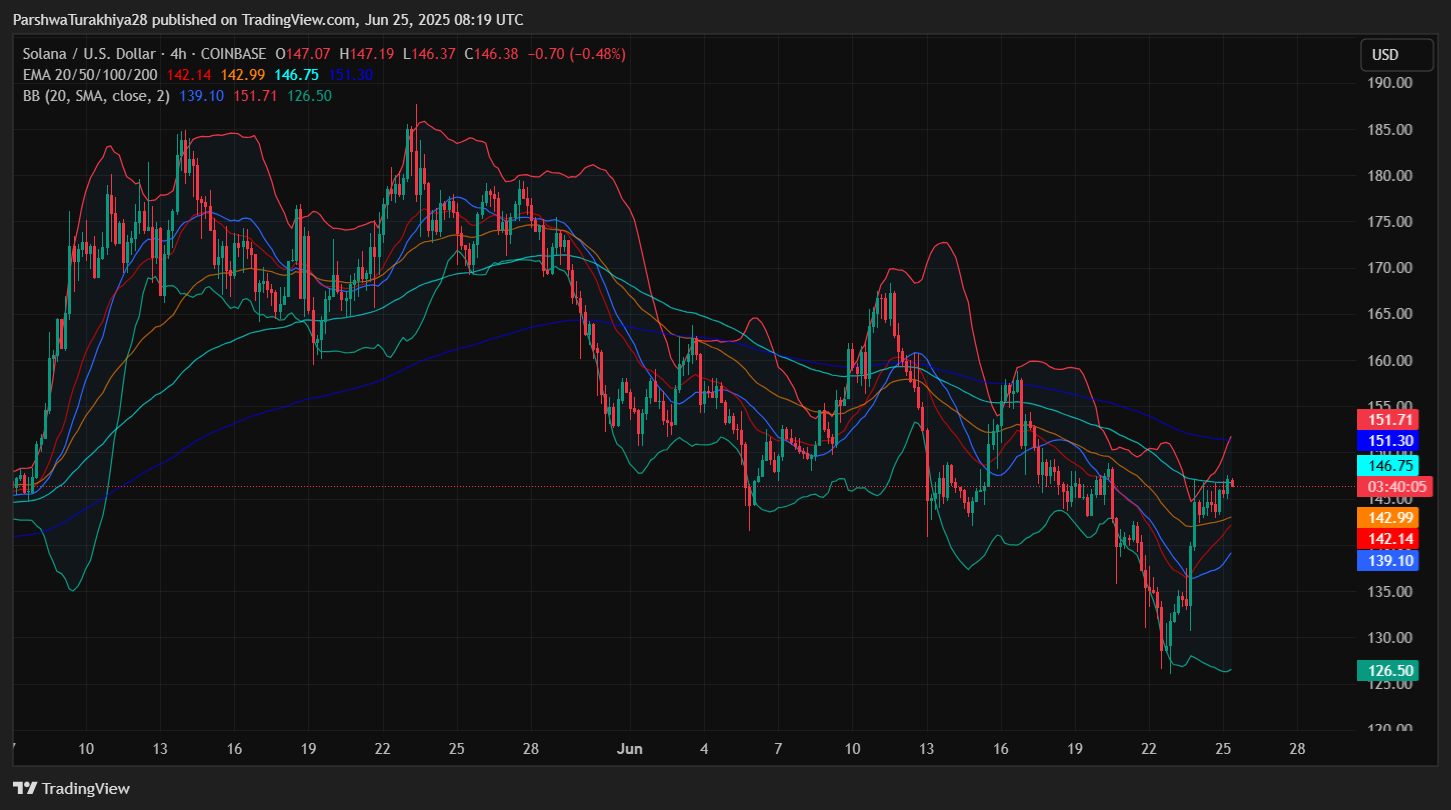
The Solana price bounced aggressively from the $126.50 lower Bollinger Band support on June 22, forming a V-shaped recovery into the $146 zone. On the 4-hour chart, SOL is now pressing against a confluence of resistance, including the 100 EMA ($146.75), 200 EMA ($151.30), and the upper Bollinger Band ($151.71).
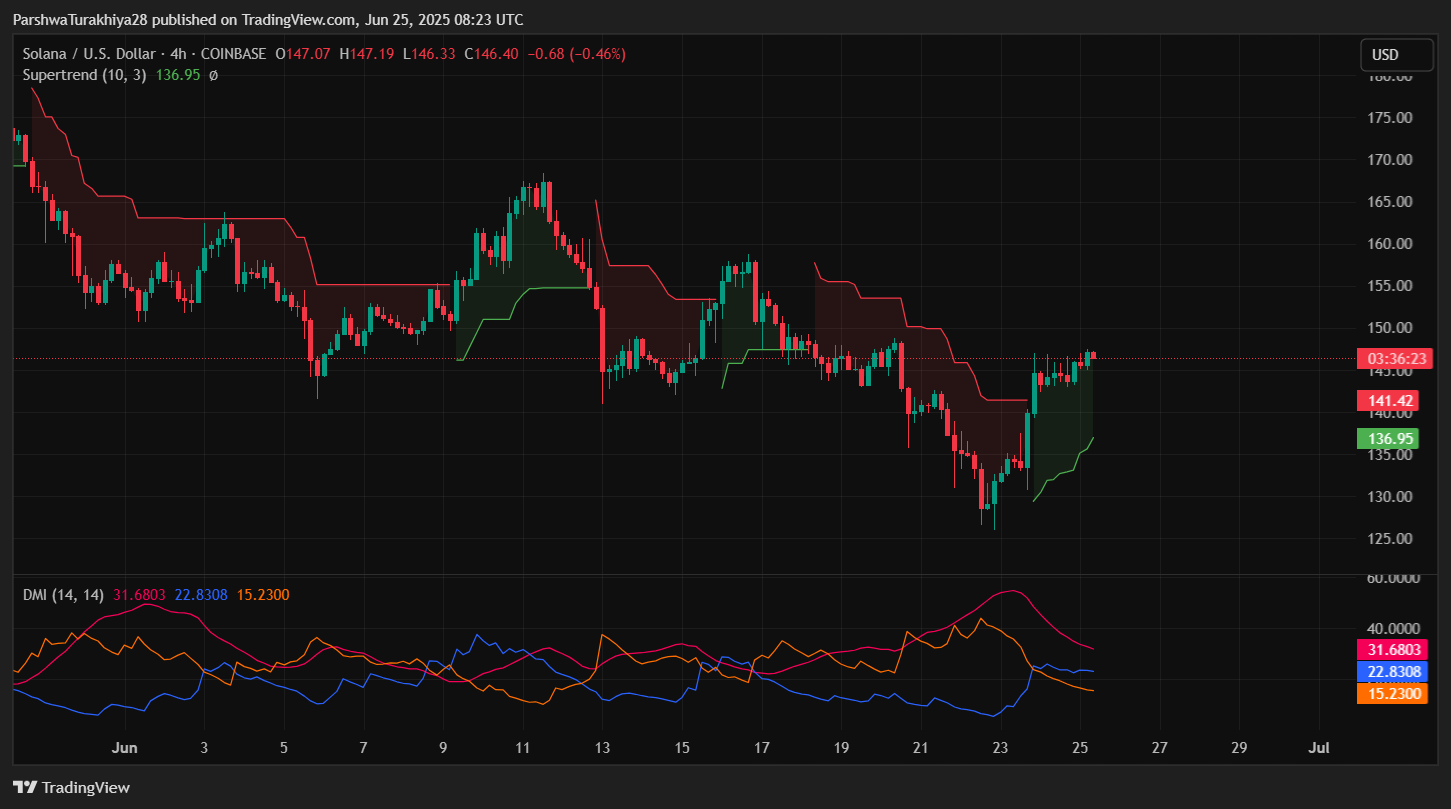
The Supertrend flipped bullish at $136.95, and price has since maintained its position above that level. DMI readings show +DI (22.83) rising against a falling -DI (31.68), but the ADX at 15.23 signals a weak trend. For bulls to confirm strength, ADX must rise above 20 with DI crossover confirmation.
On the 1-day chart, SOL remains range-bound within a descending Fibonacci channel. The upper boundary of this range sits near $169.29, while pivot support lies at $143.77 (S3 level). For any medium-term bullish structure to resume, price needs to decisively break above $151 and flip the trendline.
Why Solana Price Going Up Today?
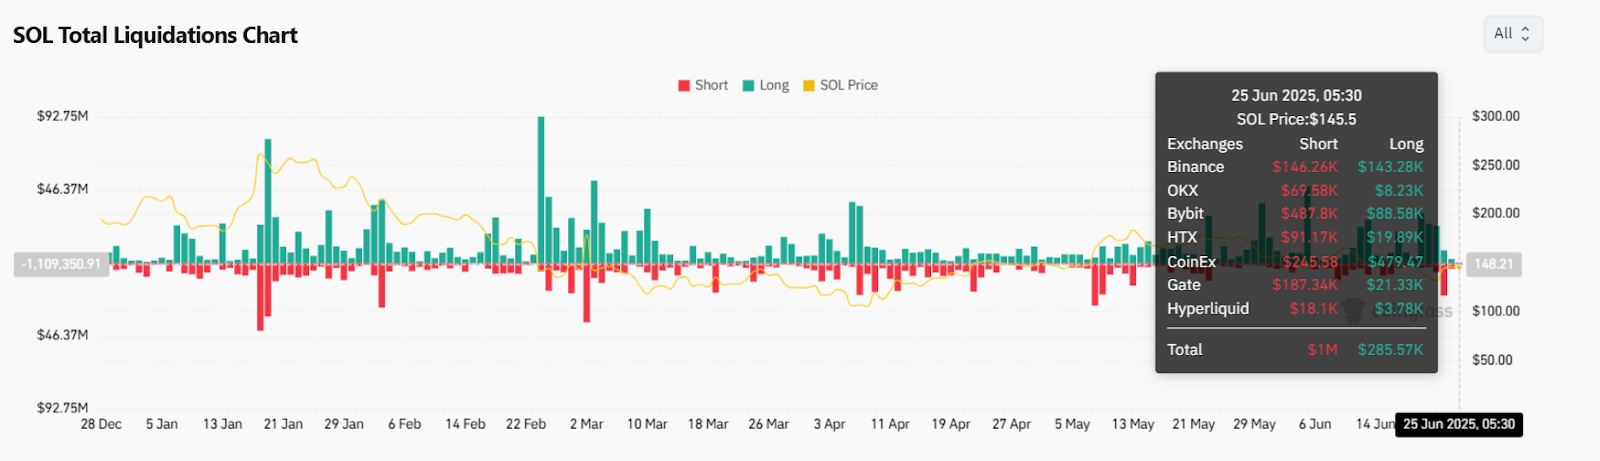
The current rally in Solana price today is fueled by a combination of short liquidation pressure and bullish momentum signals. As seen in the liquidation chart, more than $1 million in shorts were wiped on June 25, with nearly $285,000 in long positions added during the same window. This imbalance indicates aggressive short covering, a common driver of fast-paced Solana price spikes.
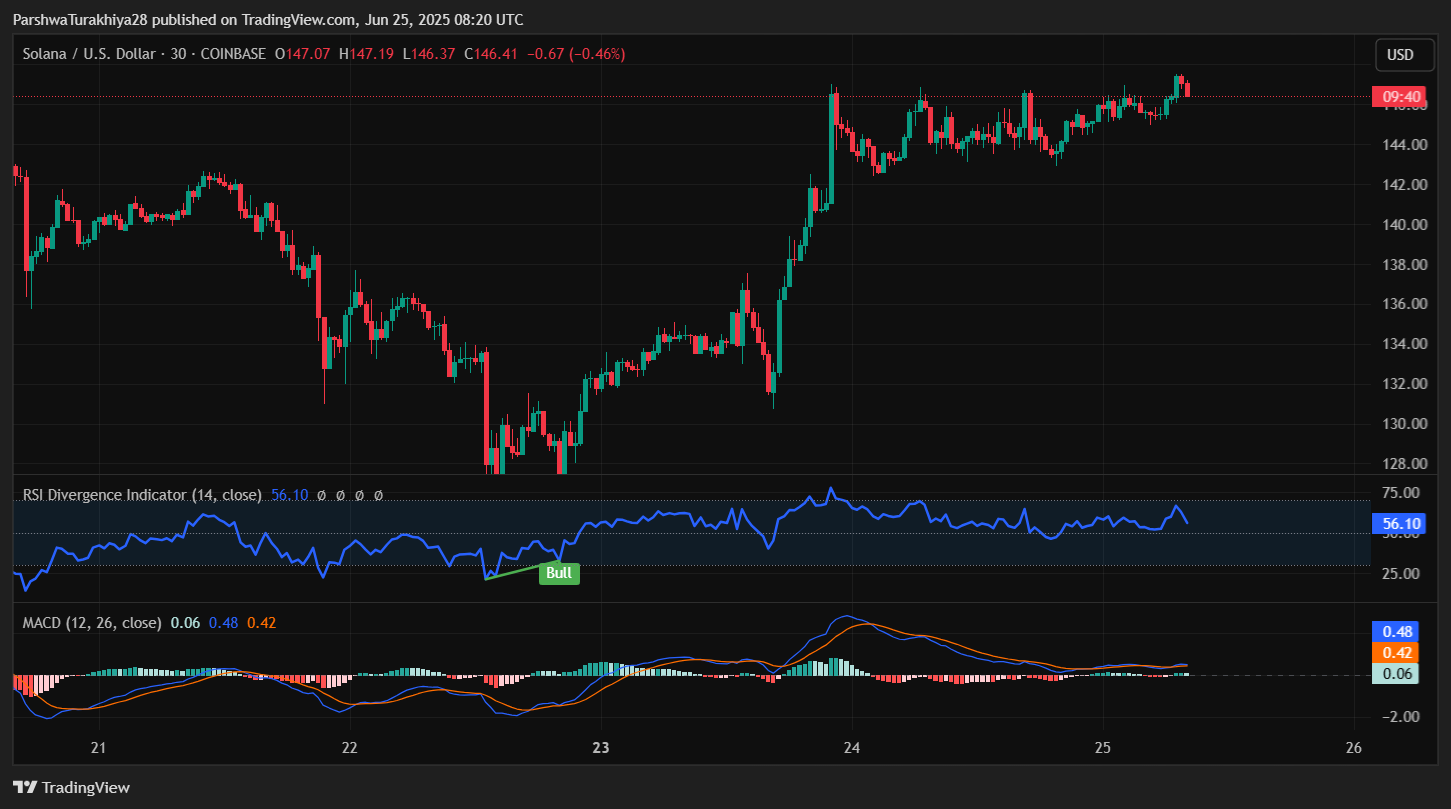
On the 30-minute chart, RSI is holding at 56.10 with bullish divergence noted on June 23, which triggered the reversal. MACD has crossed bullish and remains positive, although the histogram is flattening, signaling caution near resistance.

Ichimoku Cloud on the same timeframe shows price trading above the cloud with a bullish twist. Tenkan and Kijun lines are both supportive near $145.21. Stoch RSI, however, is entering overbought territory (currently 68.18 and 83.99), suggesting momentum may cool unless a breakout follows.
Solana Price Technical Signals Hint at Breakout Tension
The setup across multiple indicators suggests a tightly coiled structure ready for expansion. Bollinger Bands on the 4-hour chart are widening again, and Solana price volatility is on the rise. Price has also cleared the mid-band ($139.10) and reclaimed the 20/50 EMAs ($142.14 and $142.99), both of which now act as dynamic support.

From a daily perspective, SOL is pressing against the Donchian Channel median at $147.20. A breakout above $151.71 could open the door toward the upper channel at $168.38. The On-Balance Volume (OBV) remains stable at 67.69M, showing neutral inflow pressure so far, but this could shift quickly with a volume surge.
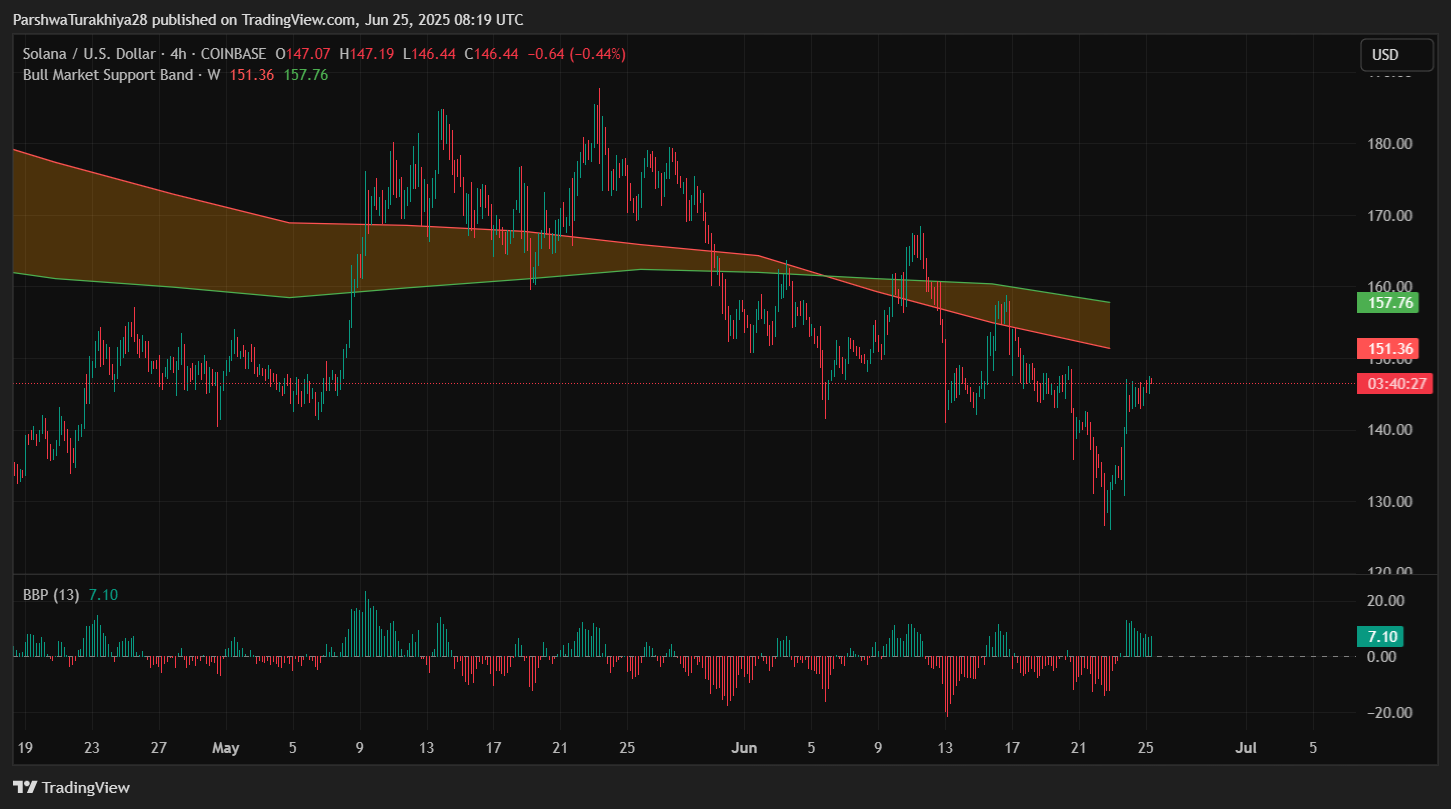
Importantly, the BBP indicator (4H) flipped positive with a value of 7.10, confirming bullish bias returning to lower timeframes. If bulls maintain current momentum, they may test the descending channel resistance near $151–$153 before facing stronger macro hurdles. However, the 4-hour Bull Market Support Band between $151.36 and $157.76 looms overhead, creating a potential supply zone. The current Solana price action suggests a temporary pause as bulls reassess strength before attempting to reclaim the trend-defining zone.
SOL Price Prediction: Short-Term Outlook (24h)

Over the next 24 hours, price direction hinges on the $146.75–$151.30 range. A clean close above $151 with volume confirmation would mark a breakout, potentially sending Solana price to $157.76 (upper Bull Band) and then $169.29 (pivot R3).
If price gets rejected from current levels, key support lies at $142.14 (EMA20), followed by $139.10 (mid-Bollinger) and $136.95 (Supertrend). A loss of these zones could send price back toward the prior bounce zone at $126.50.
Volume, OBV, and MACD crossovers should be closely watched for confirmation. If bulls remain in control, this short-term uptrend could evolve into a broader recovery. Otherwise, rejection here may reinforce the descending channel bias heading into early July.
Solana Price Forecast Table: June 26, 2025
| Indicator/Level | Value / Signal |
| Solana price today | $146.44 |
| Resistance 1 | $146.75 – 100 EMA |
| Resistance 2 | $151.30 – 200 EMA, upper BB |
| Support 1 | $142.14 – EMA20 |
| Support 2 | $139.10 – Mid Bollinger Band |
| Supertrend (4H) | Bullish above $136.95 |
| RSI (30-min) | 56.10 – Bullish but near overbought |
| MACD (30-min) | Positive – Bullish crossover intact |
| Ichimoku Cloud (30-min) | Bullish above $145.21 |
| Stoch RSI | 68.18 / 83.99 – Overbought zone |
| DMI (ADX / +DI / -DI) | 15.23 / 22.83 / 31.68 – Weak trend |
| Bollinger Bands (4H) | $126.50 (Lower) / $151.71 (Upper) |
| Bull Market Band (4H) | $151.36–$157.76 – Key breakout ceiling |
| OBV (1D) | 67.69M – Neutral volume trend |
| Liquidations (June 25) | $1M short / $285K long – Bullish tilt |
Disclaimer: The information presented in this article is for informational and educational purposes only. The article does not constitute financial advice or advice of any kind. Coin Edition is not responsible for any losses incurred as a result of the utilization of content, products, or services mentioned. Readers are advised to exercise caution before taking any action related to the company.


