 Price Prediction for March 6: Bullish Momentum Tested at Key Resistance and Support Levels")
- Bullish momentum persists, but resistance at $146 could limit further gains.
- RSI remains weak, while MACD hints at a potential bullish reversal ahead.
- Derivatives data signals mixed sentiment, with rising options open interest.
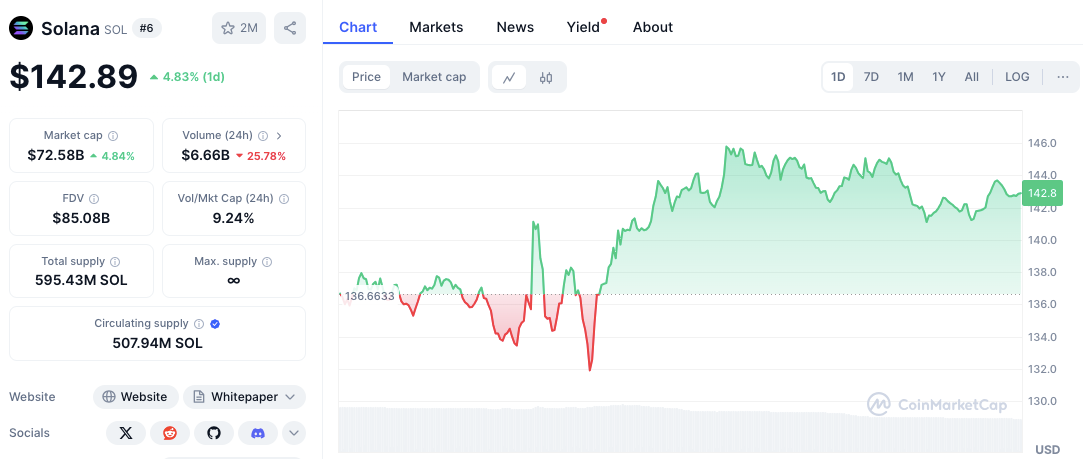
Solana (SOL) has continued a strong bullish run, increasing by 4.14% in the last 24 hours. The price climbed from $136.66 to over $144 before settling slightly at $142.39.
Even with lower trading volume, the overall market sentiment stays positive. Investors are watching closely key resistance and support levels. They want to see if the uptrend will continue or reverse. Technical indicators are giving mixed signals.
This means SOL’s movement on March 6 could hinge on breaking critical levels and keeping bullish momentum.
Mixed Signals as SOL Tests Key Price Points
SOL has formed crucial support levels, ensuring stability during price pullbacks. The strongest support zone is at $136.66 and is the lowest price seen lately.
Also, the $138-$140 range acted as a consolidation zone leading up to the latest rally. This shows active buying interest in this area. If the price falls below these levels, further corrections down toward $135 could occur.
Resistance at $146 — Key Barrier for Further Gains
Looking at resistance, the highest point reached in this cycle was above $146. This marks a major barrier for additional gains. The $144-$145 range also proved to be a difficult level to overcome.
The price met selling pressure around this area. A clear breakout above $146 could open the door for further upside potential. This could possibly push SOL up toward the $150 mark in the short term.
Related: SOL Price Prediction: How Will 3 Million Unstaked Tokens Affect Its Value?
Technical Indicators Show Uncertain Momentum for SOL
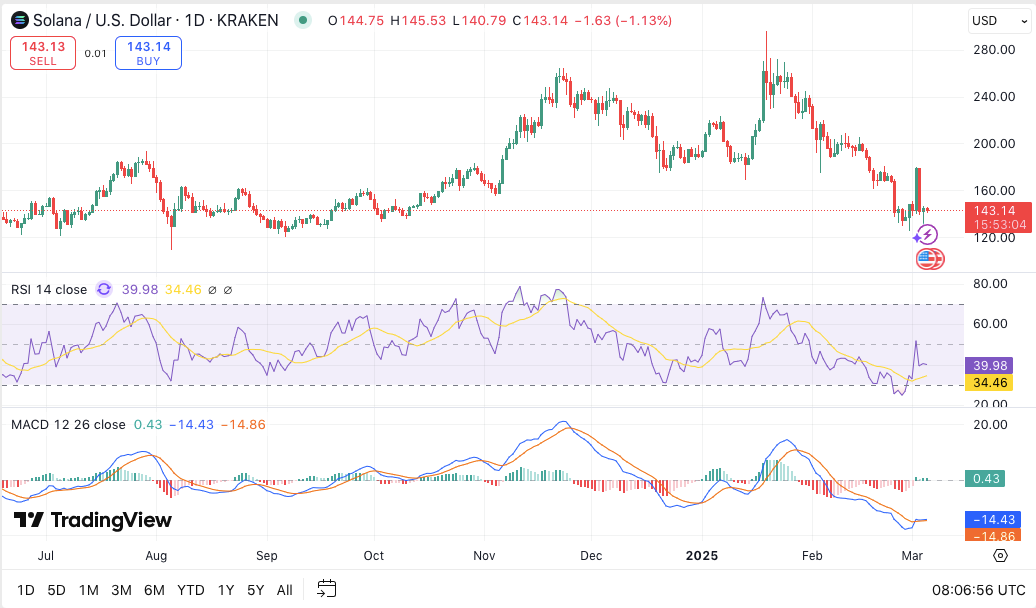
Technical Indicators and Momentum: Momentum indicators show mixed signals for SOL. The Relative Strength Index (RSI) is currently at 39.84. This indicates weak momentum.
While the RSI has risen from oversold territory, pointing to a possible rebound, it remains below the neutral 50 level. This shows that buying pressure is not yet dominant.
The Moving Average Convergence Divergence (MACD) indicator presents a slightly different picture. The MACD line has crossed above the signal line, hinting at a potential bullish reversal.
However, the histogram stays negative. This means bearish momentum has not completely faded. If the MACD keeps rising, it could confirm a trend shift upward.
Derivatives Data Shows Mixed Trader Sentiment
The derivatives market data shows mixed trends. According to Coinglass data, trading volume in Solana’s derivatives market has dropped by 28.06% to $15.58 billion.
This suggests lower speculative activity. Yet, open interest has increased slightly by 0.81% to $3.99 billion to indicate that traders are still placing bets on future price movements.
Related: Solana Futures ETFs Listed on DTCC, Spot ETF Hopes Rise
Options trading presents a different trend, with volume rising by 11.71% to $5.28 million, signaling growing interest in SOL’s price action. Moreover, options open interest has surged by 34.76% to $10.77 million, suggesting a rise in demand for options contracts.
Disclaimer: The information presented in this article is for informational and educational purposes only. The article does not constitute financial advice or advice of any kind. Coin Edition is not responsible for any losses incurred as a result of the utilization of content, products, or services mentioned. Readers are advised to exercise caution before taking any action related to the company.


