
- Cardano (ADA) is retesting the 20-day EMA which is a major resistance at $0.80.
- Solana (SOL) has formed three consecutive bearish daily candles.
- SOL token price drop is a result of the LIBRA pump and dump scheme.
Solana (SOL) has stayed as the most popular blockchain in the past year especially as its meme tokens exploded on the blockchain network. However, SOL is in for a stiff competition from Cardano (ADA) as the blockchain is being upgraded.
While asset management firm Grayscale has said they plan to offer Solana and Cardano spot exchange-traded funds (ETFs) soon, CoinMarketCap data shows that SOL has crashed to the $180 price level, dropping a huge 17% in the past week. A major reason for this price drop is the launch of LIBRA meme coin and the pump and dump that followed it.
Related: Solana Meme Coin Chaos: Scandals Spark Investor Risk Debate
Solana Meme Coin Hype Fades, Hurts SOL Price
Galaxy Research said in a report on Monday that LIBRA has damaged the reputation of meme coins on Solana, one of the major reasons why the altcoin shot up to new all-time highs in the past year.
A similar scenario was seen when TRUMP and MELANIA tokens launched, and the interest in Solana is now going down.
Related: SOL Price Outlook & Blockchain Flows: Base Leads, Solana Resilient
Cardano DeFi Upgrade & XRP Link Fuel ADA Bullishness
On the other hand, Bitcoin DeFi is coming to Cardano, and market participants are bullish about the upcoming upgrade.
The blockchain network is also expected to partner with the issuer of XRP, the third-largest cryptocurrency by market cap. Market analysts have stated that as long as ADA is trading above the $0.5 price level, the altcoin’s market will remain bullish.
ADA vs. SOL: Price Action Diverges
ADA is trading at $0.7718, down almost 4% in the past 24 hours even though volume has surged 30%. The altcoin retested the resistance at the 20-day exponential moving average (EMA) but failed to turn this region into support. The 20-day EMA stands at $0.80.
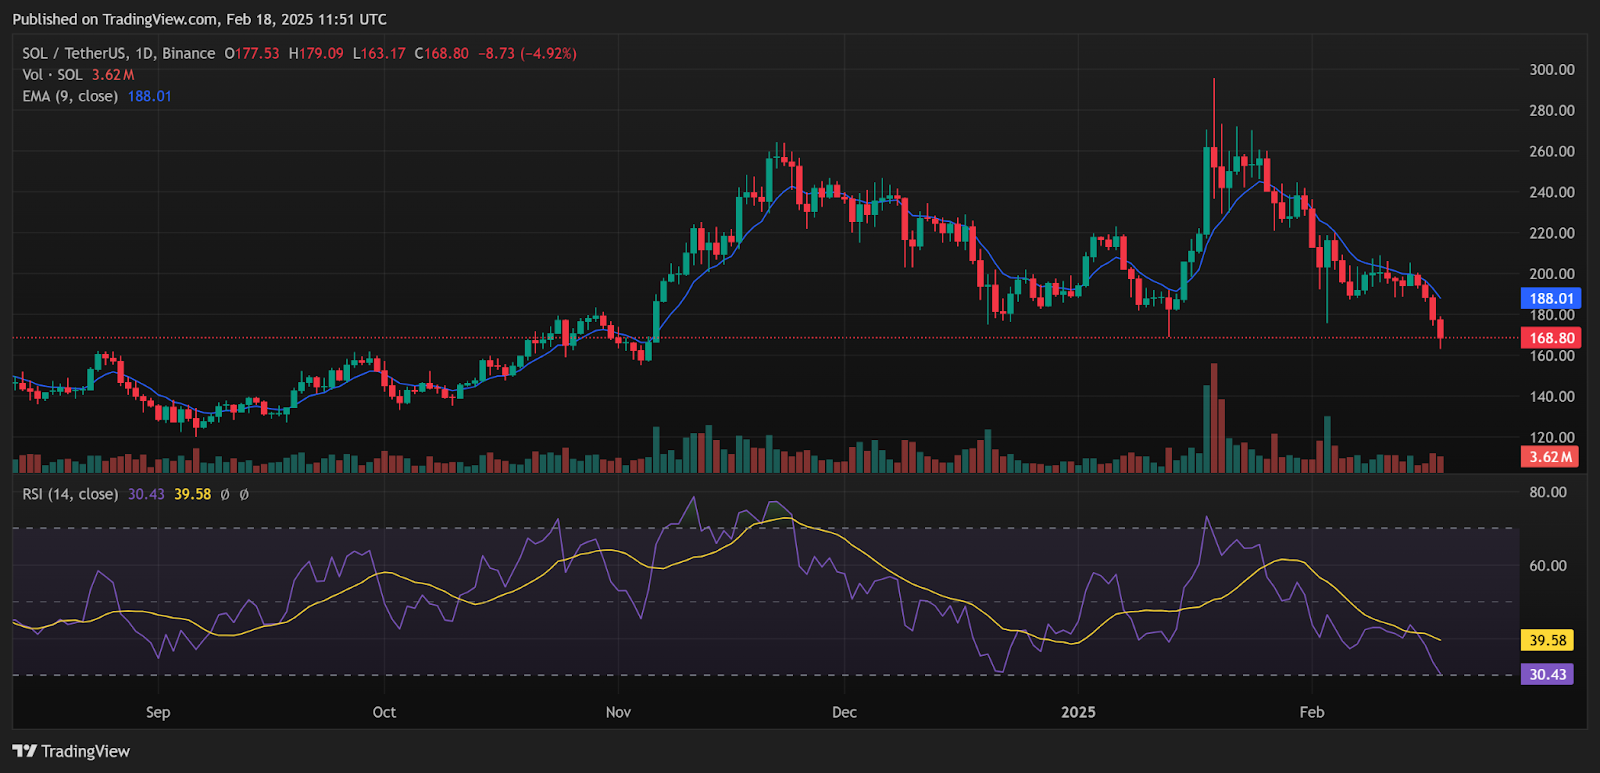
However, SOL token lost the 20-day EMA at the start of February and has formed three consecutive bearish daily candles, as shown on the chart below. The altcoin is about to enter the oversold region on the Relative Strength Index (RSI) which reads a value of 30.43.
Disclaimer: The information presented in this article is for informational and educational purposes only. The article does not constitute financial advice or advice of any kind. Coin Edition is not responsible for any losses incurred as a result of the utilization of content, products, or services mentioned. Readers are advised to exercise caution before taking any action related to the company.


