- SOL price stabilizes around $19.50, implying possible sideways movement.
- Bearish trend may continue; next support levels at $18.50 and $18.00.
- CMF suggests buying pressure, but KST and RSI indicate a bearish trend.
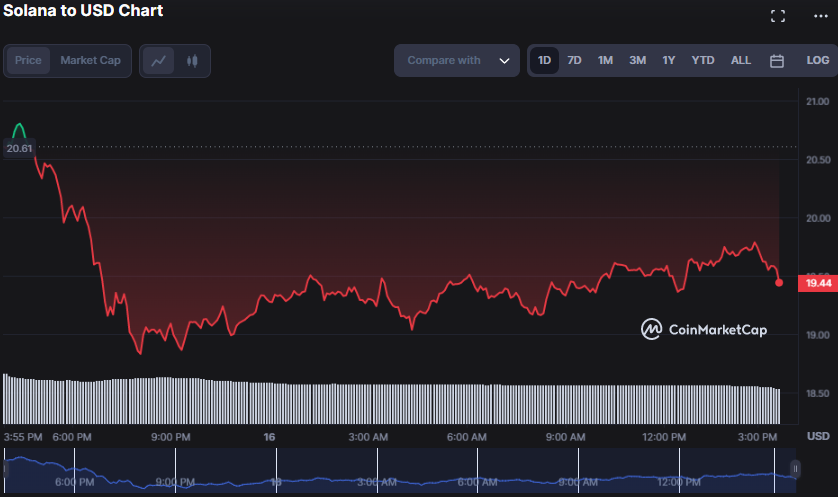
The Solana (SOL) market opened the day positively, jumping to a 24-hour high of $20.82. This bullish domination, however, was short-lived as bulls failed to break through resistance and retraced to a low of $18.83, where support was established. The price stabilizes around $19.50, suggesting that sideways movement may continue.
If bearish forces prevail, the $18.83 support level may be broken, the next support levels may stand at $18.50 and $18.00. If positive momentum strengthens, the price may break over the $20.00 barrier level and test higher levels in the medium term.
During the slump, market capitalization, and 24-hour trading volume fell by 6.03% and 33.53%, respectively, to $7,487,868,989 and $721,956,785. This decline can be attributed to investors’ tendency to liquidate their investments during a market retreat as they anticipate further market declines.

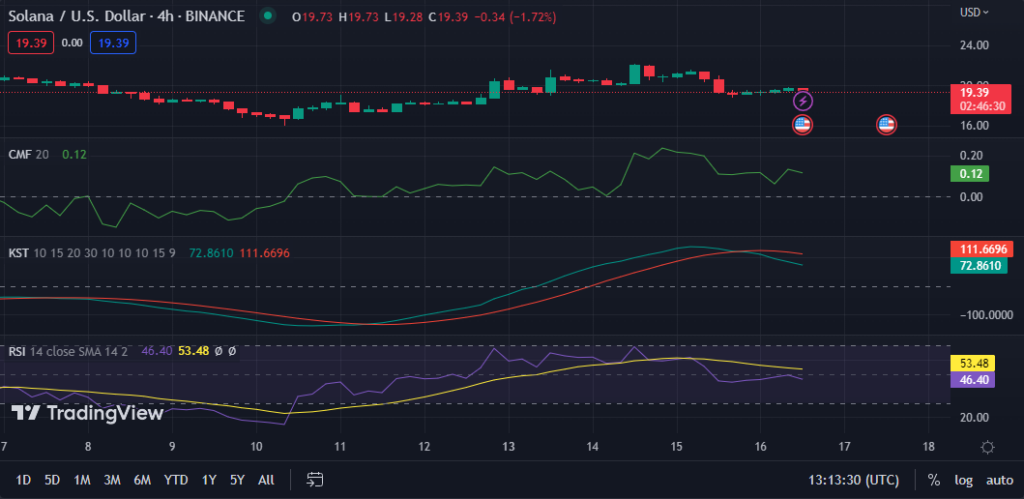
Although bearish, the Chaikin Money Flow (CMF) movement in the positive range with a score of 0.11 implies that there may still be some buying pressure in the SOL market. However, moving closer to the “0” line indicates waning buying pressure, and a stronger negative trend may emerge if the CMF drops below 0.
With a value of 72.4516, the Know Sure Thing (KST) indicator has crossed below its signal line on the 4-hour price chart, indicating that the negative trend in SOL may continue in the short term. The KST crossing below its signal line is considered a bearish indication.
The Relative Strength Index (RSI) falls below its signal line reading of 46.32, adding to the bearish mood. This crossing indicates a possible increase in selling pressure and further downward momentum.

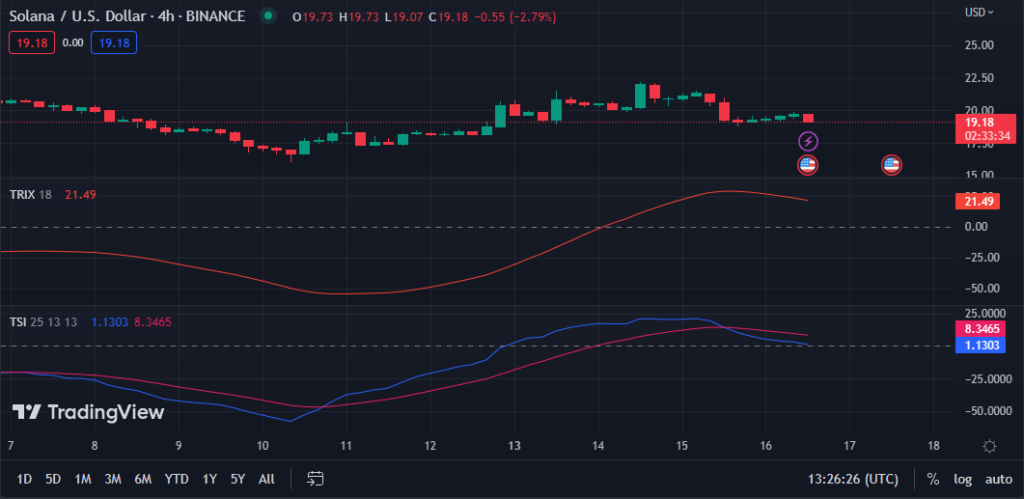
The TRIX reading of 21.56 indicates that the SOL negative trend is losing pace and that a trend reversal is probable. But, because it is going southwards, the bullish reversal may not be instantaneous, so traders should place suitable stop-loss orders to control their risk if the trend continues downward before reversing.
The True Strength Index (TSI) is trending below its signal line reading of 0.9841, indicating a negative market momentum that may extend the downward trend. This movement suggests that the expected reversal may not materialize soon, and traders should be cautious when considering long positions.

SOL faces a bearish trend with possible buying pressure, but traders should be cautious as downward momentum may continue.
Disclaimer: The views, opinions, and information shared in this price prediction are published in good faith. Readers must do their research and due diligence. Any action taken by the reader is strictly at their own risk. Coin Edition and its affiliates will not be liable for direct or indirect damage or loss.
Disclaimer: The information presented in this article is for informational and educational purposes only. The article does not constitute financial advice or advice of any kind. Coin Edition is not responsible for any losses incurred as a result of the utilization of content, products, or services mentioned. Readers are advised to exercise caution before taking any action related to the company.


