
- The total market cap of stablecoins surged by 0.48% in seven days since May 2022.
- A surge in stablecoin valuation suggests an increase in liquidity across exchanges.
- Tether USD is the most traded crypto with a volume of $51B, followed by Bitcoin and Ether.
The total market capitalization of stablecoins has surged to $173 billion, a level not seen since May 2022. This significant increase in stablecoin demand could foreshadow a pullback in Bitcoin’s price as investors accumulate liquidity and await a favorable entry point.
According to data from DefiLlama, the total market valuation of stablecoins rose by 0.48% in the past week, reaching a new high since May 2022. The sector is currently valued at $173.013 billion, with Tether USD (USDT) holding a dominant 69.27% share and a market capitalization of $119.6 billion.
Read also: Brazil’s Crypto Soars on 42% Stablecoin Growth And Institutional Influx
CoinMarketCap data shows that USDT is currently the highest-traded cryptocurrency in the industry, with a massive volume of $51 billion. Bitcoin (BTC) and Ether (ETH) are ranked second and third, with volumes of $27.5 billion and $14 billion, respectively.
Increased Stablecoin Market Cap Could Signal a Bitcoin Dip
A rising stablecoin market capitalization typically suggests increased liquidity on digital asset trading platforms. This may indicate that investors are waiting for a market correction to enter the market. As a result, it is possible that Bitcoin might dip slightly before stablecoins are used and exchanged for altcoins and BTC.
At the time of press, Bitcoin has surged 2.87% in the past 24 hours and is trading at $64,568, up 7.65% in the past month and 140.26% since October 2023. The leading digital asset saw a 69% surge in its trading volume and is trading at a discount of 12.37% from its all-time high of $73,750 printed earlier this year.
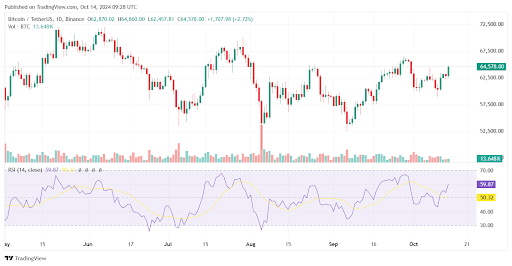
As per the chart provided by TradingView above, the Relative Strength Index (RSI) for Bitcoin reads a value of 59.87 which means that the bulls are overall in charge of the cryptocurrency’s price action. Moreover, the gradient of the line suggests that higher prices are possible.
Disclaimer: The information presented in this article is for informational and educational purposes only. The article does not constitute financial advice or advice of any kind. Coin Edition is not responsible for any losses incurred as a result of the utilization of content, products, or services mentioned. Readers are advised to exercise caution before taking any action related to the company.

 Price Prediction: Can Bulls Reclaim the 0.236 Level?")

 Price Prediction: Can Bulls Break the $329 Barrier?")
