 Price Prediction 2025, 2026, 2027, 2028, 2029-2030")
Sui price has surged nearly 14% to reclaim a major breakout zone, putting bulls firmly back in control. With indicators turning decisively positive and higher timeframe patterns aligning, the question now is how far SUI can climb through 2030 amid rising network interest and liquidity flows.
Sui (SUI) Price Prediction 2025
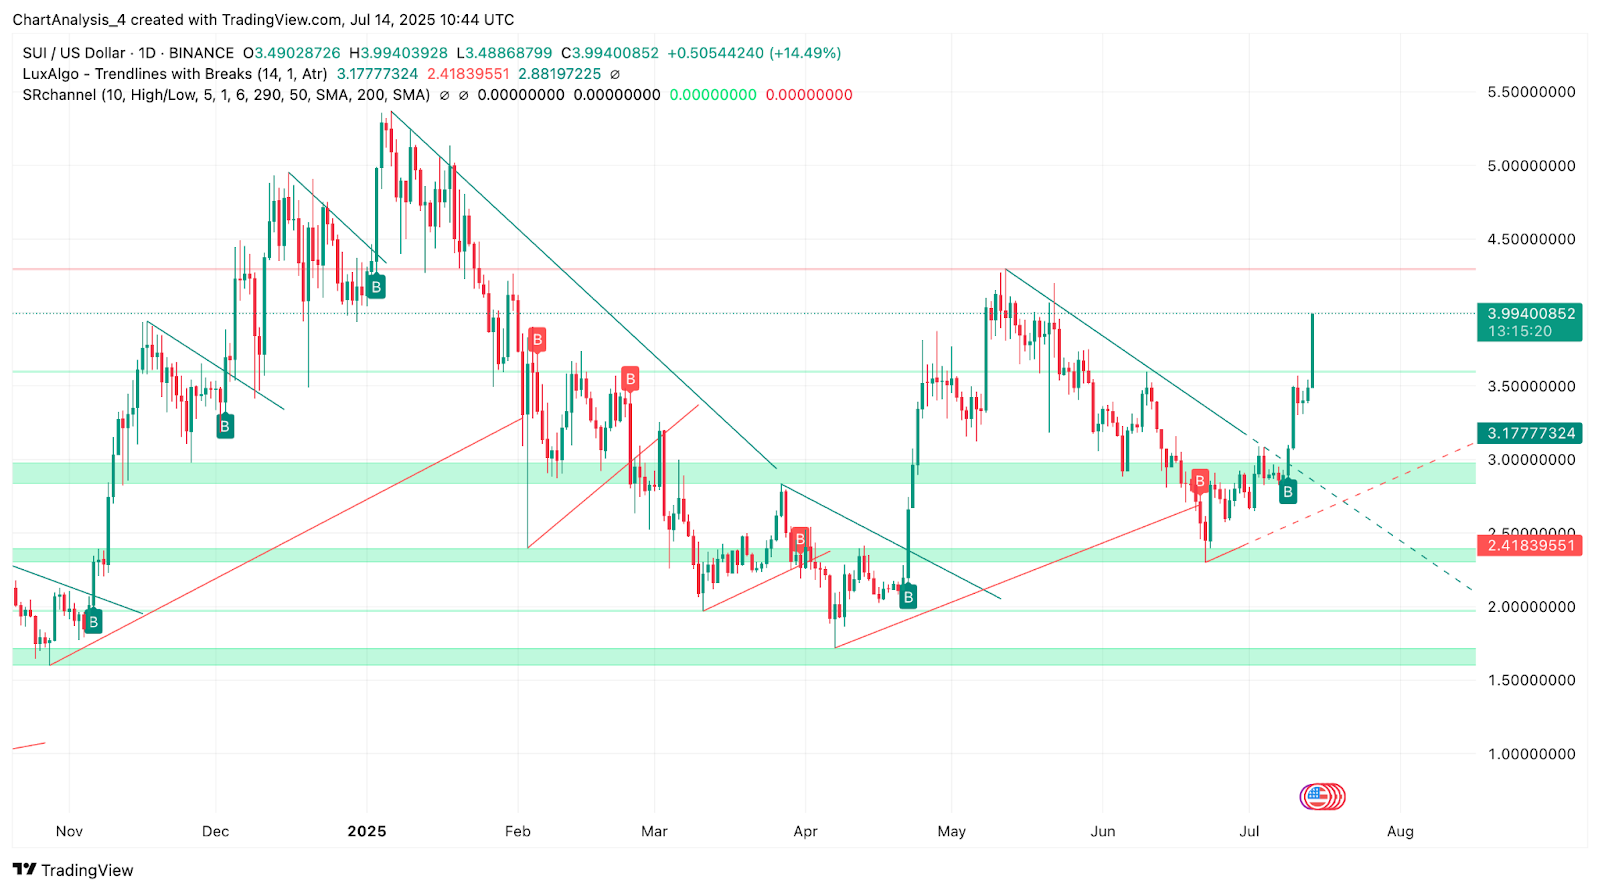
Sui price today is trading around $3.95, having surged over 14% in a single day to break above a key descending resistance line. The bullish impulse followed a clean bounce from the $3.17 zone and confirmed structure shift above the $3.50 handle.
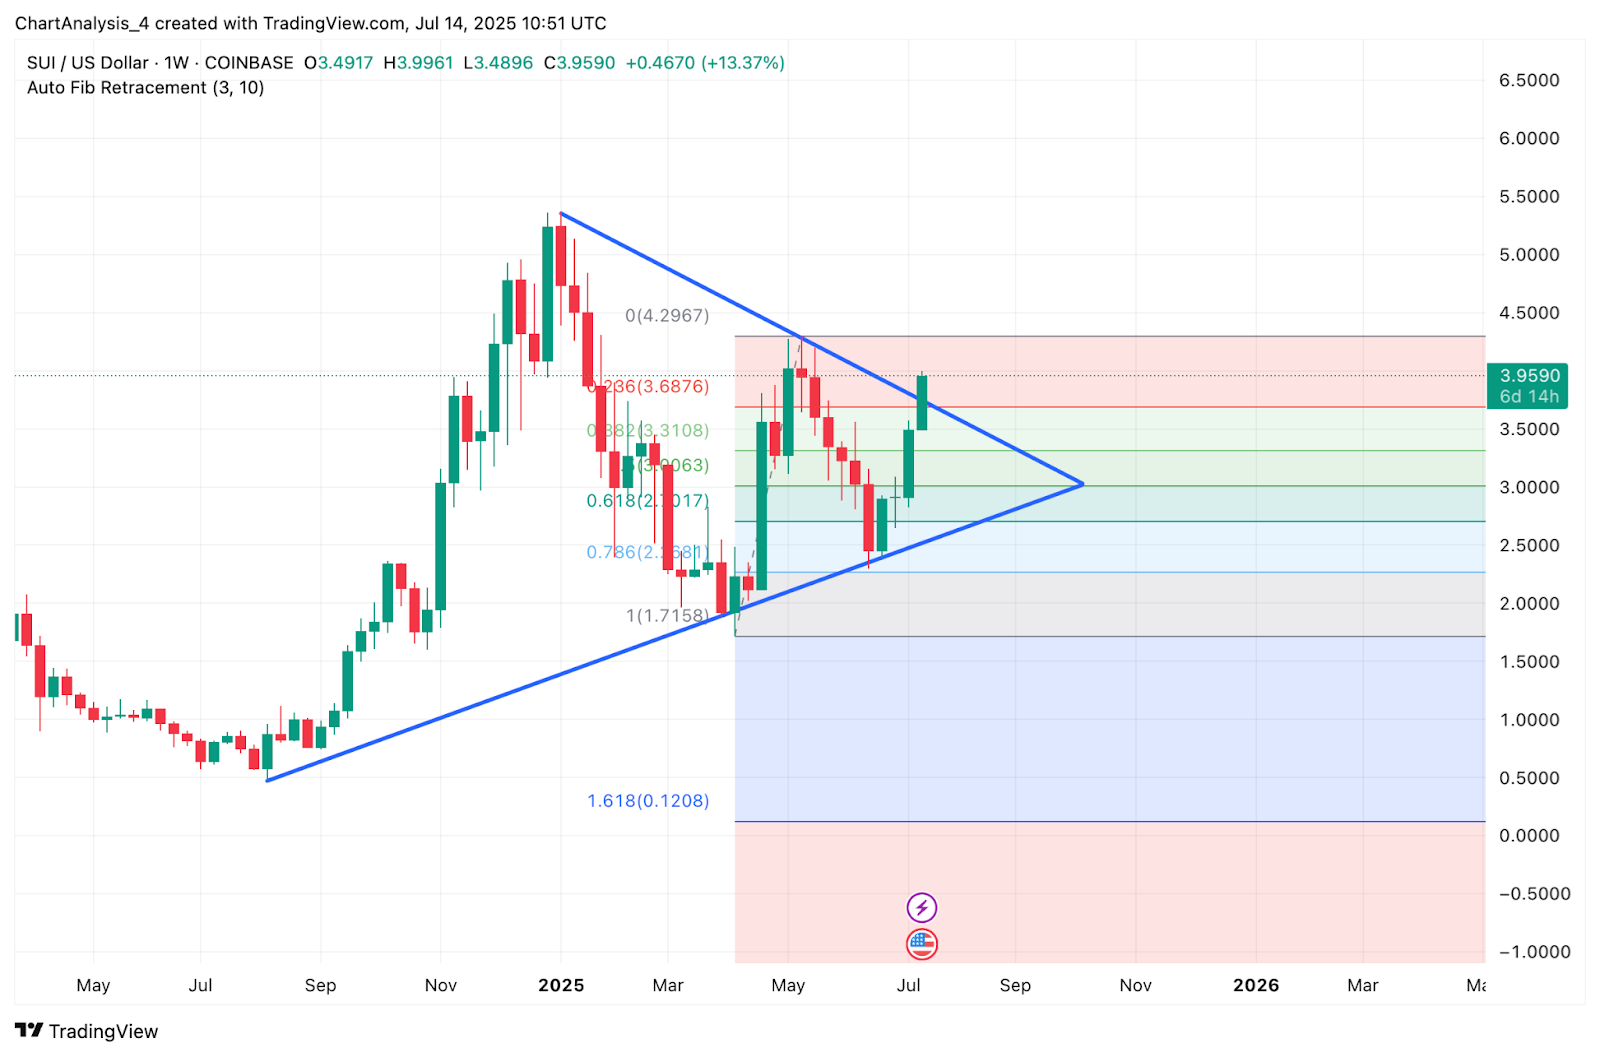
This breakout move places SUI on track to revisit higher Fibonacci levels, with the 0.382 retracement at $3.31 already reclaimed and the 0.236 zone at $3.68 under attack. The weekly chart shows SUI breaking out of a symmetrical triangle that began forming in Q1 2025, signaling the beginning of a broader continuation trend.
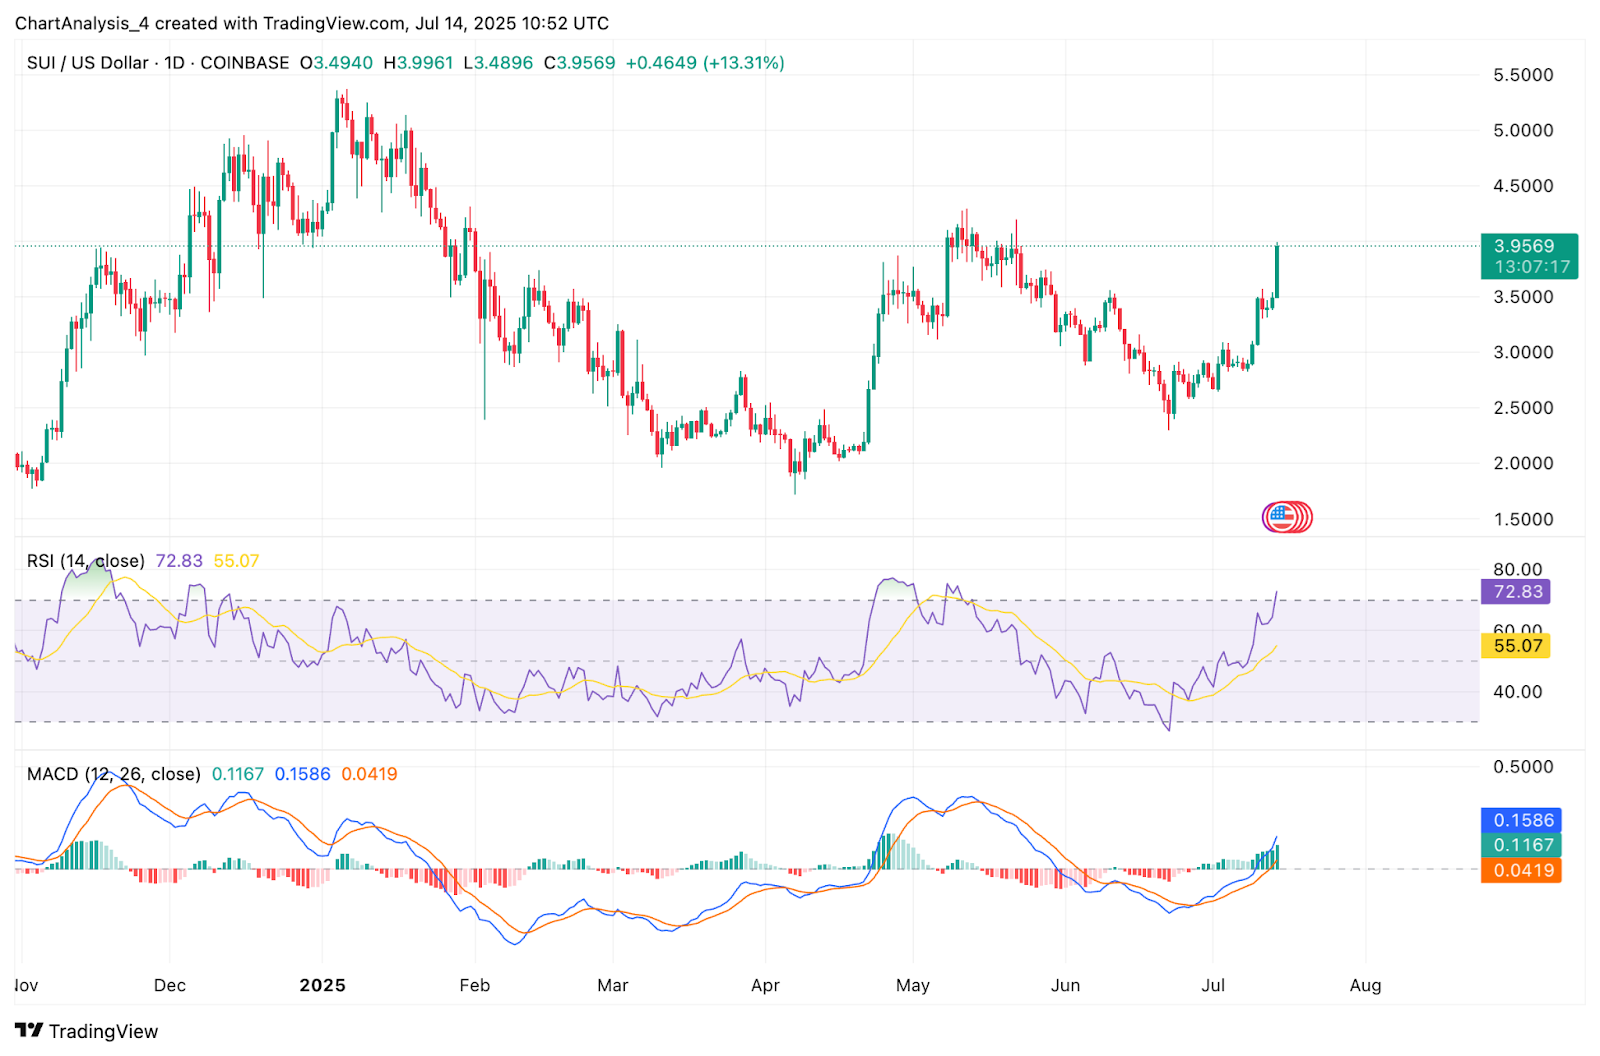
SUI price dynamics also show renewed momentum on smart money indicators, with the recent move disrupting the $3.50–$3.96 supply zone and targeting the previous swing high near $4.30. On the daily chart, SUI has overcome several structural lower highs and confirmed a bullish change of character. With the RSI now at 72 and MACD lines accelerating, momentum remains skewed toward the upside.
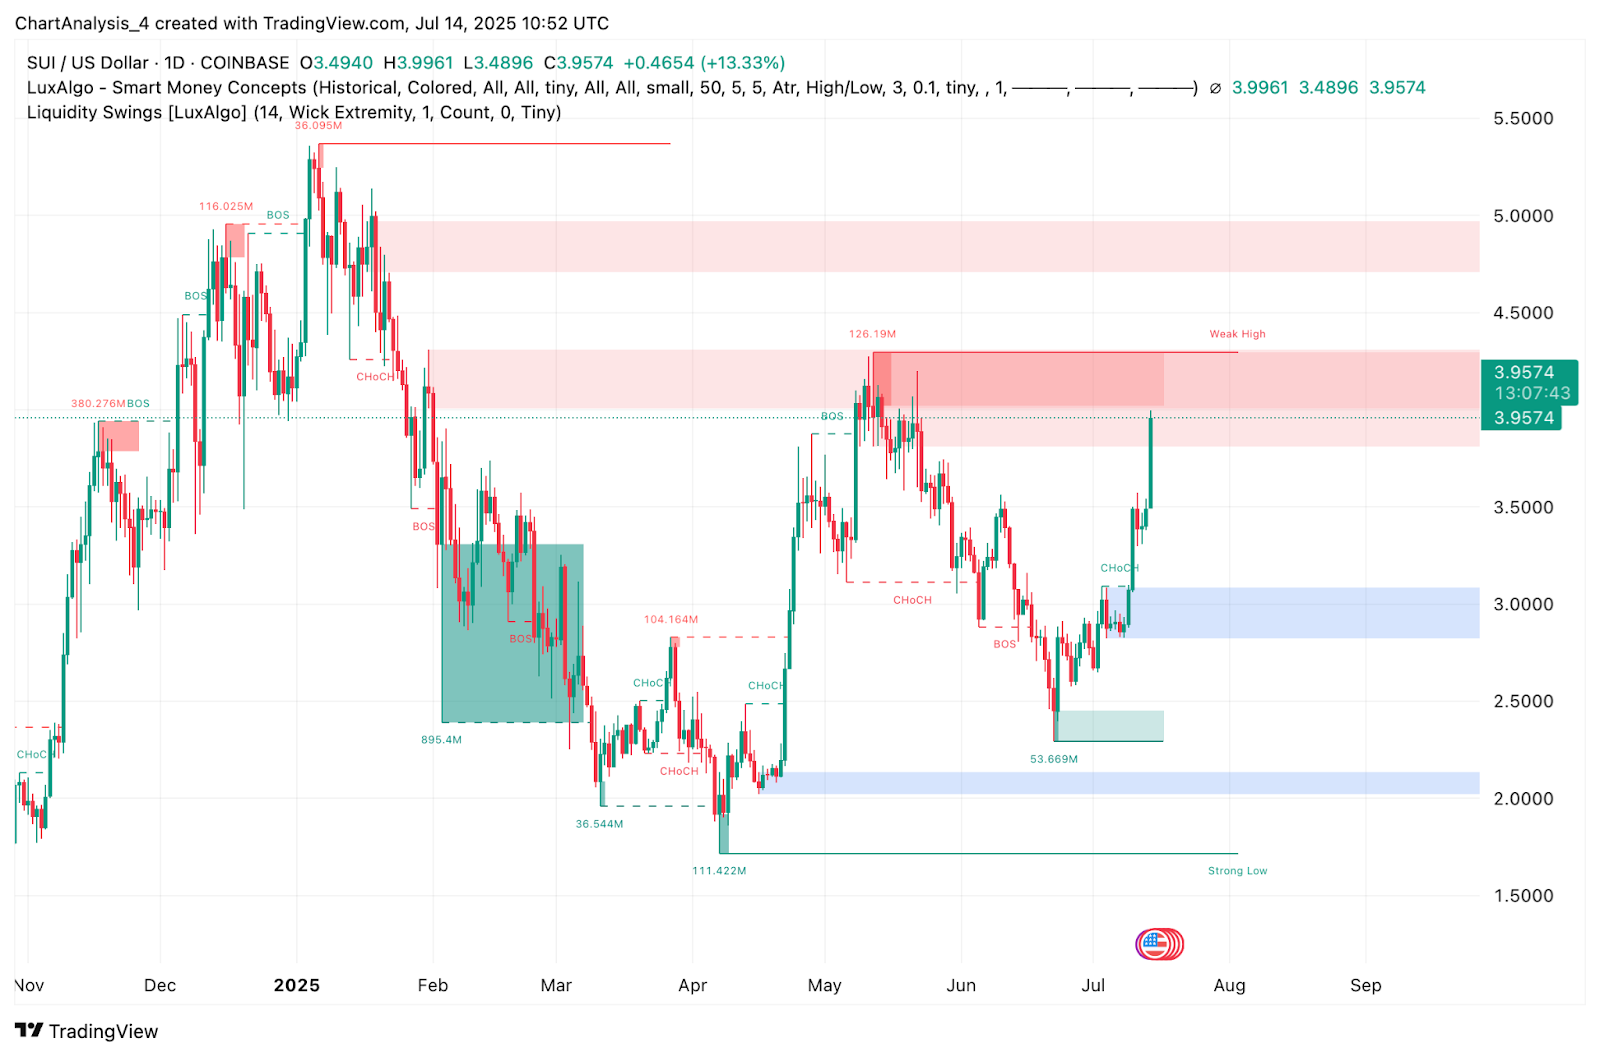
The presence of unfilled liquidity above $4.30 further supports the idea of continued upside into year-end. Liquidity heatmaps indicate smart money is targeting imbalance zones near $4.50 and possibly $5.00 if this breakout sustains.
Sui (SUI) Price Analysis (Signals and Indicators)
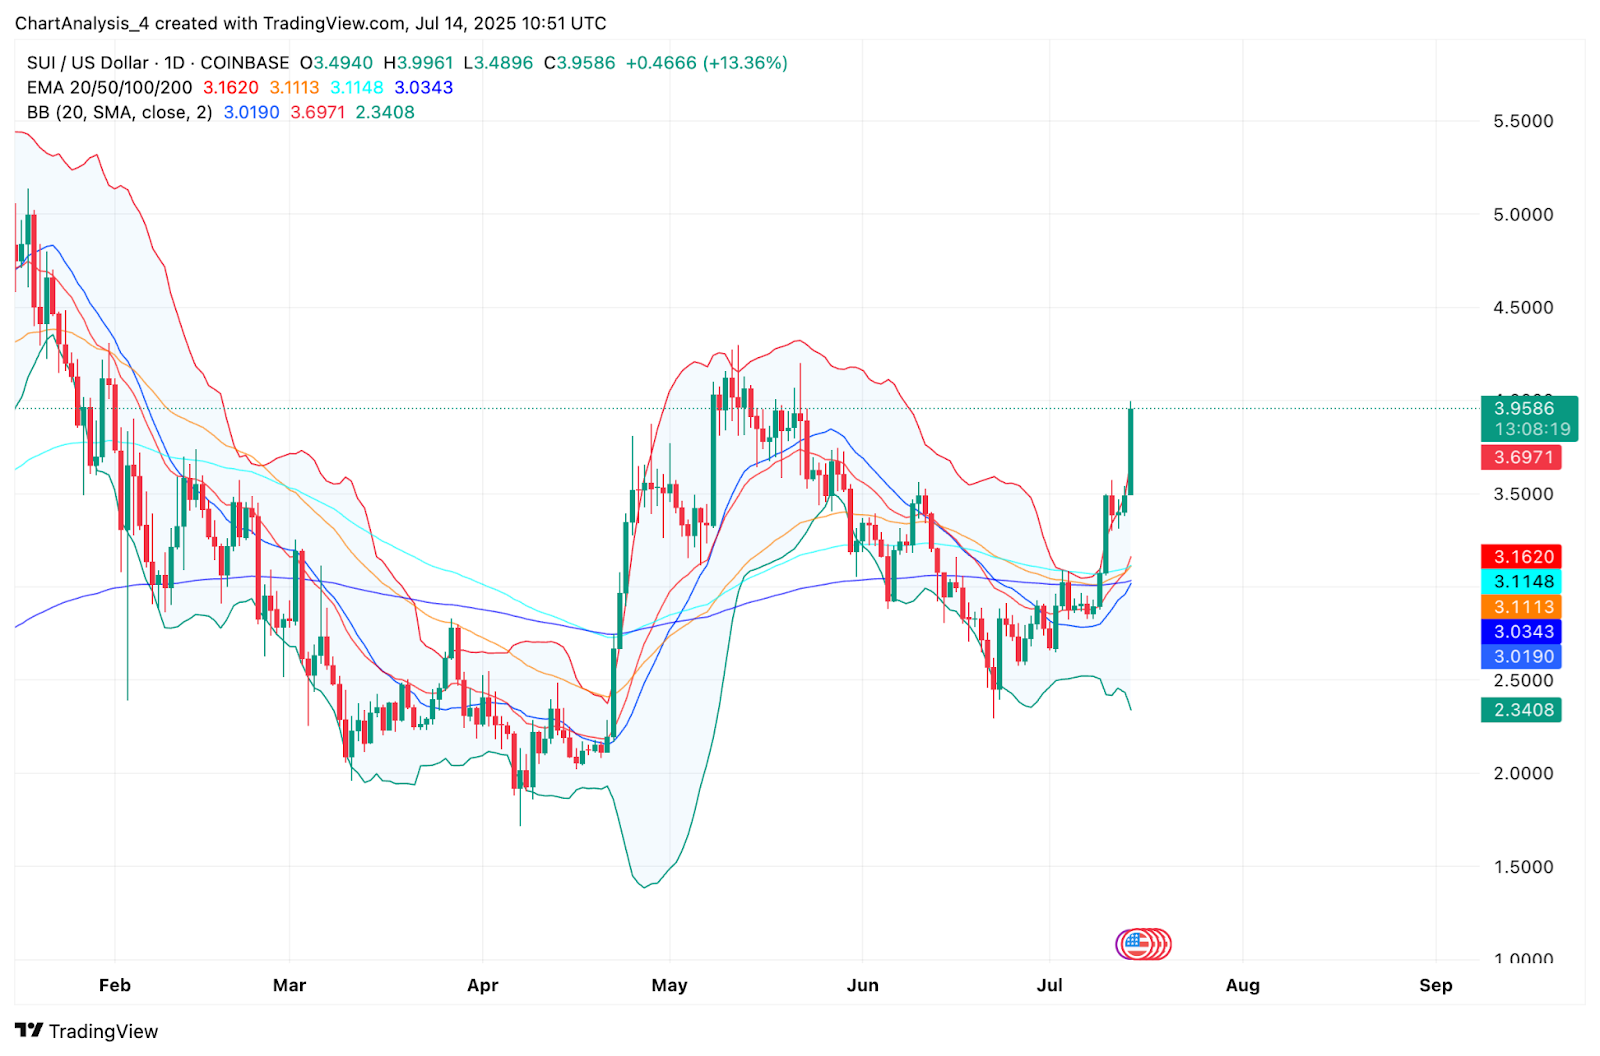
SUI price has reclaimed its 20-day, 50-day, and 100-day exponential moving averages, with the 200 EMA now converging near $3.03. This cluster acts as a reinforced demand zone. Bollinger Bands have sharply expanded following weeks of tight compression, highlighting the volatility breakout. The upper band at $3.69 is being tested with strength, suggesting a push toward $4.30 is underway.
Sui (SUI) Price Targets 2025–2030
| Year | Potential Low ($) | Potential Average ($) | Potential High ($) |
| 2025 | 2.40 | 3.60 | 4.80 |
| 2026 | 2.85 | 4.20 | 5.60 |
| 2027 | 3.50 | 5.30 | 6.90 |
| 2028 | 4.30 | 6.40 | 8.20 |
| 2029 | 5.00 | 7.30 | 9.50 |
| 2030 | 6.20 | 8.50 | 11.00 |
Sui (SUI) Price Prediction 2026
In 2026, Sui may capitalize on the breakout from its long-term consolidation pattern. If bullish control persists above $4.00, continuation toward $5.60 could follow, especially if the broader Solana ecosystem gains traction. Potential consolidation could develop between $3.10 and $4.20, allowing time for EMAs and weekly volume structure to support higher base formation.
Sui (SUI) Price Prediction 2027
By 2027, SUI could complete a rounded bottom formation on the higher timeframe charts, pushing beyond the previous all-time high. The macro trend may favor an expansion phase targeting $6.90, especially if institutional adoption and DeFi activity on Sui network deepen. Correction levels may revisit $3.50, but the long-term trajectory appears structurally bullish.
Sui (SUI) Price Prediction 2028
As market cycles mature into a full bullish wave by 2028, SUI may benefit from broader altcoin expansion. Price could push toward $8.20 if strong demand holds above the $5.00 pivot. Volume trends and market dominance metrics may guide short-term pullbacks, but a well-supported EMA base could continue attracting buyers.
Sui (SUI) Price Prediction 2029
In 2029, mid-cycle retracements may lead to temporary weakness, but structural higher lows are expected to defend the $6.00–$6.50 support range. If bullish patterns remain intact, SUI could reclaim momentum toward $9.50. MACD divergences on the weekly timeframe may guide sentiment during this period of deeper consolidation and reaccumulation.
Sui (SUI) Price Prediction 2030
Looking toward 2030, SUI could reach new price discovery zones if smart contract and real-world asset adoption increase. With higher timeframe breakout patterns and network upgrades driving long-term interest, a high near $11.00 remains feasible. Support zones above $6.20 would need to hold to sustain bullish credibility into the next cycle.
Conclusion
Sui price outlook has turned decisively bullish in 2025, with multiple indicators confirming the strength of its current breakout. With the symmetrical triangle breakout on the weekly chart, expanding Bollinger Bands, overbought RSI, and rising MACD, SUI may be entering a new long-term uptrend. If the price holds above the $3.10–$3.50 region, the path toward higher Fibonacci levels and price discovery zones remains intact through 2030.
Disclaimer: The information presented in this article is for informational and educational purposes only. The article does not constitute financial advice or advice of any kind. Coin Edition is not responsible for any losses incurred as a result of the utilization of content, products, or services mentioned. Readers are advised to exercise caution before taking any action related to the company.


