


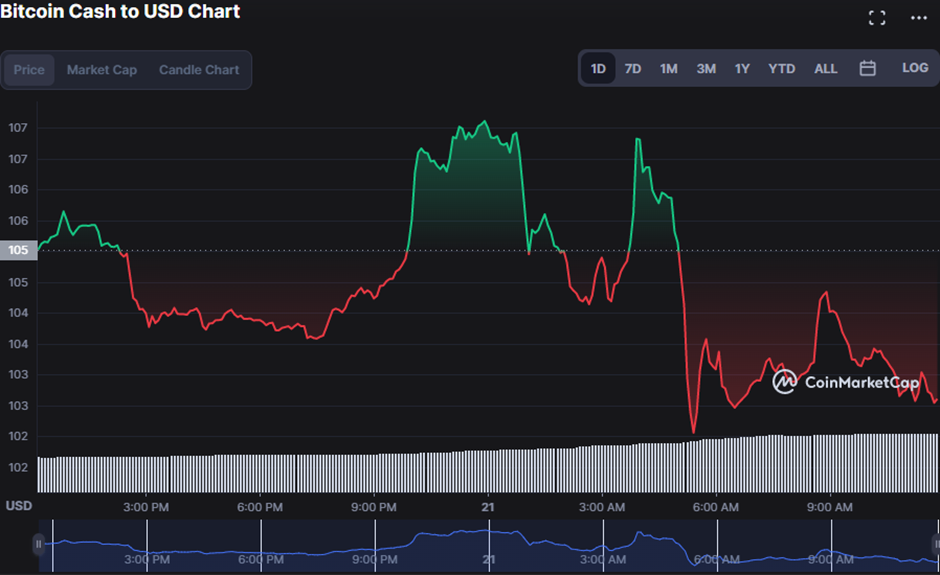
- Despite bullish efforts, prices dropped to $103.11
- Analysis of Bitcoin Cash reveals that digital currency has endured a significant decline.
- BCH faced resistance at $107.11 and found support at $101.93 during the drop.
The price of Bitcoin Cash (BCH), which had previously had a brief positive momentum, has fallen precipitously over the past day, with a 3.17% pullback bringing prices down to $102.72.
This price drop has been triggered by growing selling pressure, as shown by the rise in 1-day trading volume of 67.64% to $309,800,302, and a market capitalization decline of 2.53 to $1,973,977,618.
The end of bear dominance is foreshadowed by a selloff with a rising BOP line, but bear control in BCH is impending since a cross-over below the “0” suggests a sell. The 2-hour price chart’s upward trend, which suggests that buyers might win out, is muted by the BOP reading, which is in the negative region at – 0.09 pointing in favor of the downside.
Bollinger bands that are widening reflect an impending bullish momentum since a breakout is more likely. The BCH price chart shows this clearly, with the top band touching 106.8 and the bottom band touching 102.5. This bullish pattern, however, is dimmed by the price fluctuations towards the lower bands.
The current bear domination in the BCH market is reinforced by the Bull Bear Power (BBP) trajectory, which is southward and in the negative area with a value of -2.5.
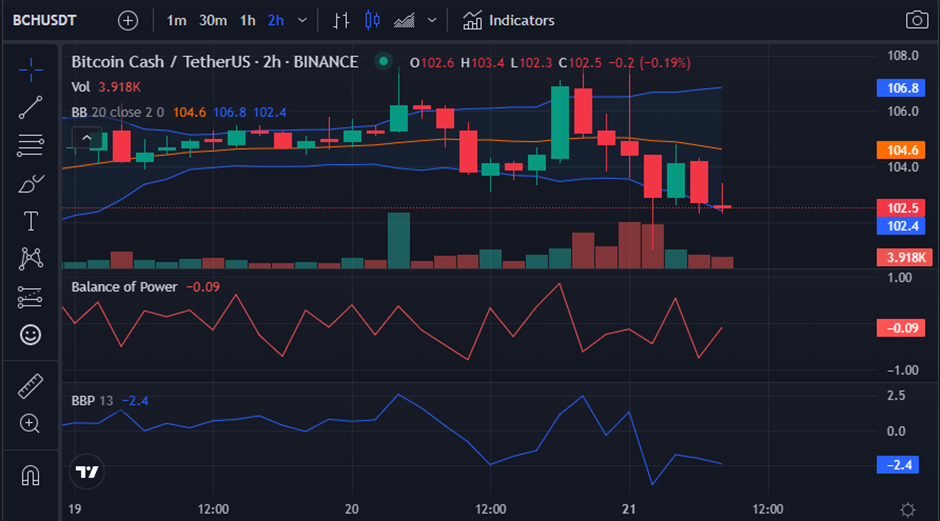
The 5-day MA crosses below the 20-day MA of 104.6 at a reading of 103.3, forming a bearish crossover pattern that validates this bear dominance. This downturn is further bolstered by the BCH price movement below the two Moving Averages.
As the Rate of Change moves towards the negative area with a value of 0.19, bearish control is expected to continue in the BCH market. The ROC motion in the positive region, however, offers some optimism for investors. If bulls apply pressure, the ROC will change course.

The digital currency may have a positive reversal if the bulls can hold the resistance level despite multiple signs pointing to another bear run.
Disclaimer: The views and opinions, as well as all the information shared in this price analysis, are published in good faith. Readers must do their own research and due diligence. Any action taken by the reader is strictly at their own risk, Coin Edition and its affiliates will not be held liable for any direct or indirect damage or loss.
Disclaimer: The information presented in this article is for informational and educational purposes only. The article does not constitute financial advice or advice of any kind. Coin Edition is not responsible for any losses incurred as a result of the utilization of content, products, or services mentioned. Readers are advised to exercise caution before taking any action related to the company.
 Price Prediction 2024-2030: Will BTT Price Hit $0.000005 Soon?")


 has plummeted by 3.17%. Read more.)