
- JASMY breaks out of multi-month downtrend, forming a bullish flag above key $0.0140 support.
- Price consolidates in a symmetrical triangle with breakout potential above $0.0153 toward $0.0176.
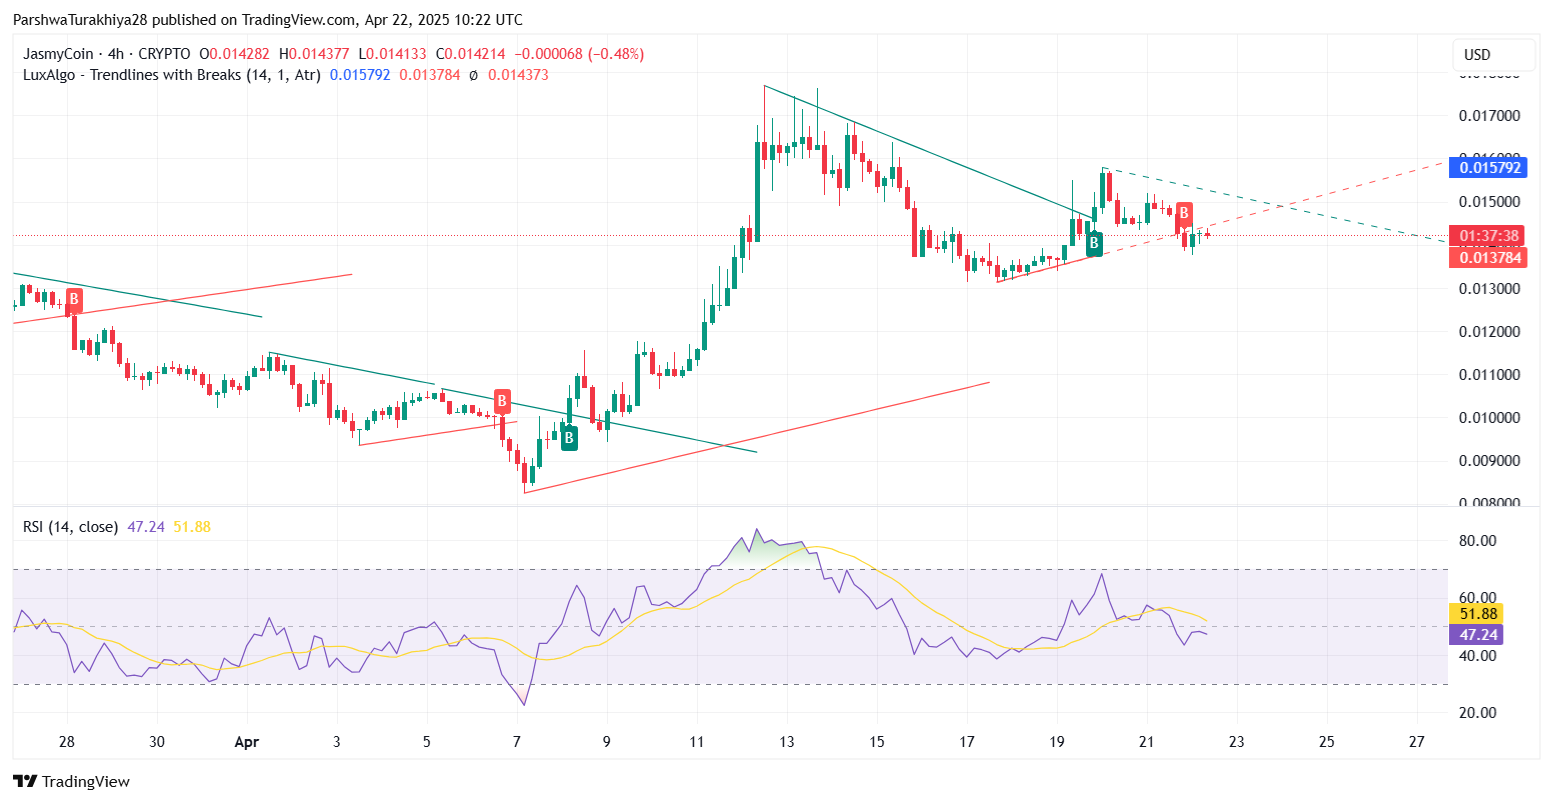
- RSI and MACD signal early bullish bias; Bollinger Bands tighten ahead of expected volatility surge.
JASMY’s price recently broke through a key downward trendline that had pushed it lower since February, signaling a potential end to that downtrend. This important break followed a strong bounce off the $0.0082 low point and led to a smaller bullish flag pattern breakout above $0.0140.
Currently, JASMY is consolidating its gains, forming a symmetrical triangle on the 4-hour chart – a pattern often indicating energy is building for a significant move. Traders are now watching for a decisive breakout above $0.0153 to potentially ignite momentum toward the $0.0158 to $0.0176 resistance area.
Where Are JASMY’s Key Support and Resistance Levels?
Immediate support rests near $0.0138. Key Fibonacci levels at $0.01296 (50% pullback) and $0.01408 (38.2%) also held firm during recent dips. Price sits just below the 20/50 EMAs (short-term averages), while longer-term EMAs mark overhead resistance near $0.01778 / $0.0207.
Related: FTT and JASMY Under Pressure — Should Holders Be Worried?
Indicators Hinting at a Volatility Spike?
Indicators hint a breakout might be brewing (per TradingView). The 4hr RSI (momentum gauge) is neutral but rising (46.91); above 50 signals buyers gaining control. MACD line crossed above signal (bullish hint), but its flat histogram shows fragile momentum needing volume confirmation.
Bollinger Bands are tightening (signaling volatility spike); price presses the Keltner upper band. A volume-backed move above $0.0153 confirms upside pressure toward $0.0176 resistance.
Short-Term Outlook: Can Bulls Break the Tie?
JASMY is currently pinned between $0.0141 and $0.0146, with volume thinning as traders await a breakout. If buyers can push price above $0.0153 on April 22, short-term targets include $0.0158 and $0.0165. A strong candle close would validate the triangle breakout pattern and shift momentum further bullish.
Related: Binance Delisting Vote Targets FTT, ZEC, and JASMY—Are These Tokens in Trouble?
For Apr 23, continuation needs RSI >50 and price holding >$0.0158. Failure at resistance risks pullback to $0.0138–$0.0134 support.
Disclaimer: The information presented in this article is for informational and educational purposes only. The article does not constitute financial advice or advice of any kind. Coin Edition is not responsible for any losses incurred as a result of the utilization of content, products, or services mentioned. Readers are advised to exercise caution before taking any action related to the company.


