


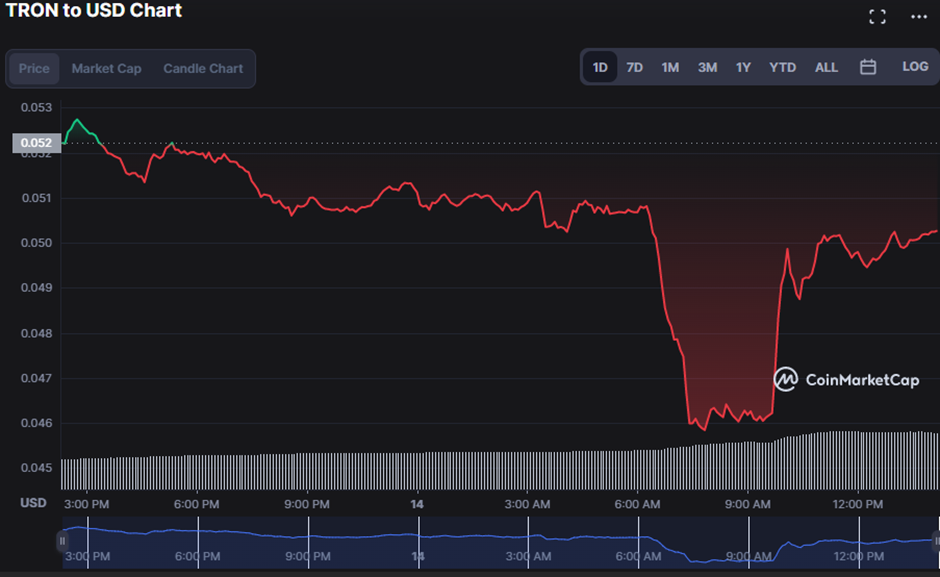
- According to a recent TRX price analysis, digital currency is in a downturn.
- TRON has a support level of $0.0458 and a resistance level of $0.05274.
- The impact of Tronpedia’s introduction has yet to be felt.
Amidst Tron’s [TRX] recent unveiling the launch of Tronpedia, a new platform where individuals can find out about the projects that Tron embraces, bears remain in control of its market.
TRX’s market capitalization fell by 3.56% in the last 24 hours to $4,647,601,678, adding to the bearish sentiment. The increased trading volume of 109.23% to $1,022,887,160 is aiding and abetting the increased selling pressure.
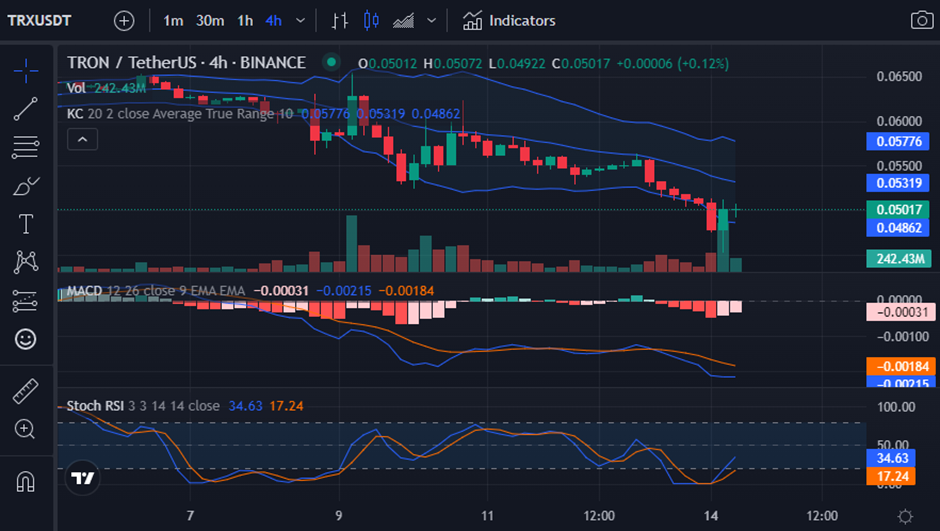
Keltner Channels bands are pointing south on the 4-hour price chart, with the upper band touching 0.05776 and the lower band touching 0.04842. The broadening of their bands implies greater selling pressure, as evidenced by the 109.53% increase in its 24-hour trading volume, implying that a bearish run is inevitable.
The MACD trajectory in the negative region, with a reading of -0.00217, supports this notion of a downturn. The blue MACD line, which has been supporting this trend, has moved below the signal line, indicating a bearish run. Furthermore, the histogram shifts into negative territory, indicating that bear dominance is likely.
The Stoch RSI reading of 37.28 is approaching oversold territory, but if the bulls continue to battle, they may invalidate this bear control because it is pointing upwards.
As a bearish crossover occurs in the TRX market, bearish momentum may be sustained. When a short-term MA crosses below a long-term MA, a bearish trend is on the way, with the 50-day moving average touching 0.05752 and the 20-day moving average touching 0.05365.
A Coppock Curve reading of -17.36534 pointing south also predicts the continuation of the current trend.
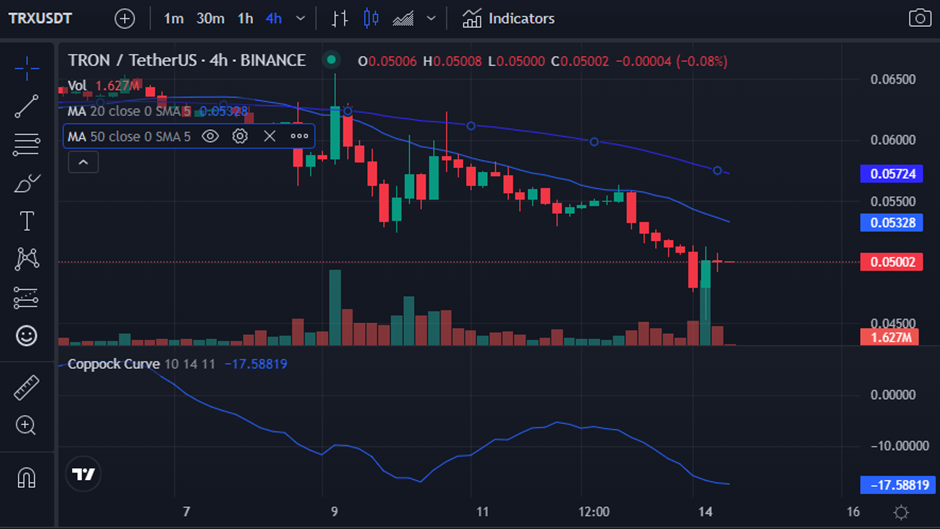
Bulls should continue to fight in order to refute the bearish trend in the TRON (TRX) market and push prices back up.
Disclaimer: The views and opinions, as well as all the information shared in this price analysis, are published in good faith. Readers must do their own research and due diligence. Any action taken by the reader is strictly at their own risk, Coin Edition and its affiliates will not be held liable for any direct or indirect damage or loss.
Disclaimer: The information presented in this article is for informational and educational purposes only. The article does not constitute financial advice or advice of any kind. Coin Edition is not responsible for any losses incurred as a result of the utilization of content, products, or services mentioned. Readers are advised to exercise caution before taking any action related to the company.


 at its $25 Infancy, Say Analysts")

