
- VeChain (VET) has flashed two rare TD Sequential buy signals on its daily chart, suggesting waning bearish momentum.
- Development activity for the project has surged 620%, placing it among the top three most active blockchains.
- A decisive close above the $0.0165 trendline could trigger a breakout toward targets of $0.0187 and $0.0205.
VeChain (VET) is showing early signs of a potential technical reversal after weeks of downward pressure. Market analyst Ali Martinez identified two rare buy signals on the token’s daily chart based on the TD Sequential indicator. These signals, an “aggressive 13” and a “red 9,” typically suggest that bearish momentum is waning and often precede a market rebound.
At the time of writing, VET trades around $0.0148, stabilizing after several volatile sessions that saw the token dip to $0.0133, as per CoinMarketCap data. However, the trading volume of the token dropped more than 25% in the past 24 hours.
Related: Michaël van de Poppe Eyes $0.12 Price Target for VET
Martinez’s chart shows both buy signals converging near the recent low, implying that sellers may be losing control as the market searches for a bottom. Historically, when these two setups align, a price reversal or short-term rally often follows.
VeChain’s Development Strength Fuels Optimism
Beyond the technicals, VeChain’s on-chain growth remains impressive with data from Chain Broker placing the project among the top three blockchains by development activity growth, up 620% in recent months, trailing only Ripple and IOTA.
Despite being down over 36% in the past 30 days, VET has gained more than 5% in the last 24 hours, showing early signs of resilience even as the token claimed a market cap of $1.27 billion.
VET Price Analysis: Chart Shows Emerging Strength
VET’s daily chart shows the token trading below a long-term descending trendline while consolidating just above a critical support zone between $0.0132 and $0.0145. This green area has served as a demand base multiple times throughout 2024.
Bollinger Bands are narrowing, signaling declining volatility, a setup often preceding major breakouts. The RSI sits at 35.9, near oversold territory, indicating that bearish momentum may soon give way to a rebound. The MACD histogram remains slightly negative, but its lines are converging, i.e., a bullish divergence might be likely.
Meanwhile, the Chaikin Money Flow (CMF) reads -0.13, indicating mild capital outflows as the Balance of Power (BoP) at -0.44 also confirms bearish dominance.
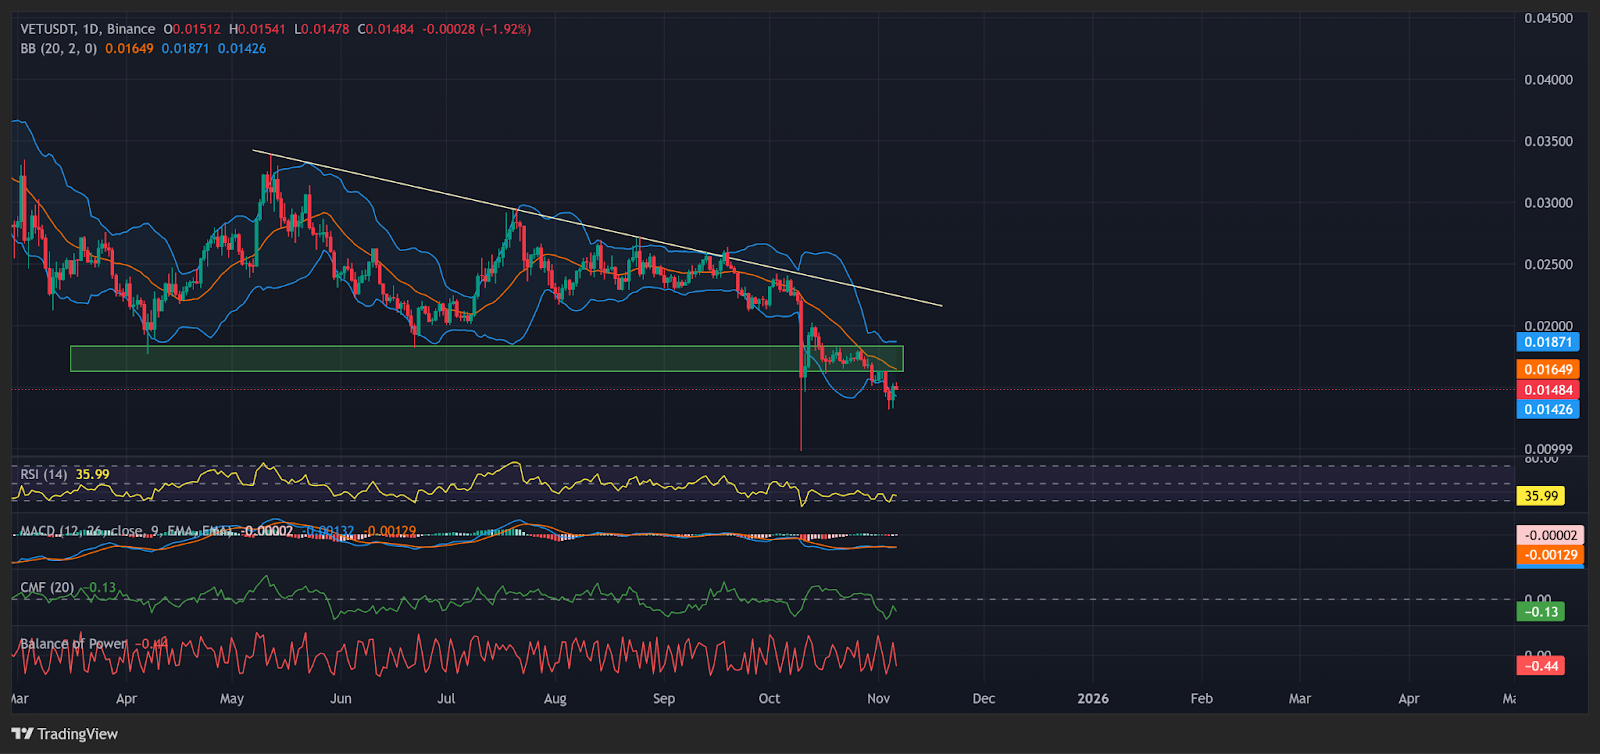
If VET manages to close decisively above the descending trendline near $0.0165, it could trigger a bullish breakout targeting $0.0187, followed by $0.0205 if momentum accelerates. However, failure to hold the support zone around $0.0132 could expose VET to deeper corrections toward $0.0115.
Related: VeChain Eyes 200% Rally With Upgrades and Staking
Disclaimer: The information presented in this article is for informational and educational purposes only. The article does not constitute financial advice or advice of any kind. Coin Edition is not responsible for any losses incurred as a result of the utilization of content, products, or services mentioned. Readers are advised to exercise caution before taking any action related to the company.


 Price Prediction 2026–2030: Governance Overhaul And Bridge Adoption Eyes $1")
