 Price Prediction for July 29, 2025: VINE Skyrockets Above $0.15 But Rising Wedge Signals Caution")
After trading below $0.05 for most of July, Vine Coin price exploded higher in the past 48 hours, piercing above multiple resistance zones and peaking near $0.172. At the time of writing, Vine Coin price today is hovering around $0.153, following a parabolic surge driven by structural breakout, rising momentum, and strong spot inflows. While the rally has shifted momentum firmly in favor of bulls, early signs of exhaustion are beginning to appear on intraday charts.
What’s Happening With Vine Coin’s Price?
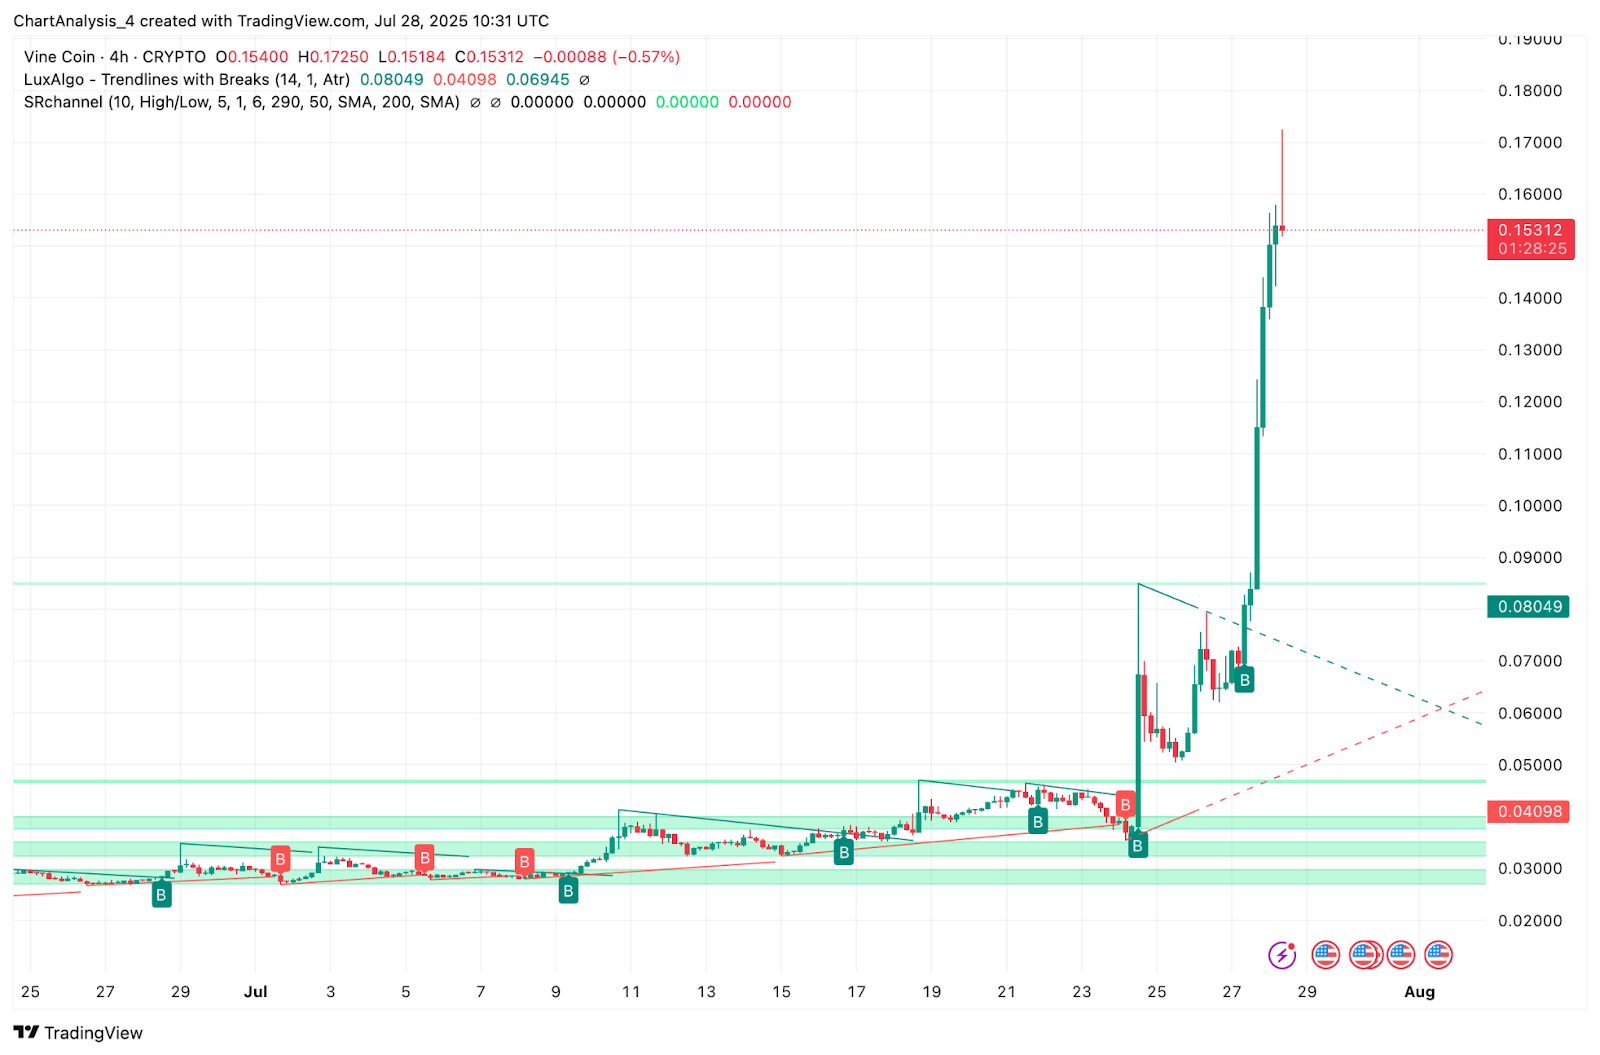
On the 4-hour chart, VINE completed a clean breakout from a multi-week symmetrical triangle. This triggered a vertical rally through previous resistance zones at $0.069 and $0.080. The breakout was supported by a series of bullish continuation structures, including compressed flag formations and prior consolidation blocks between $0.035 and $0.045.
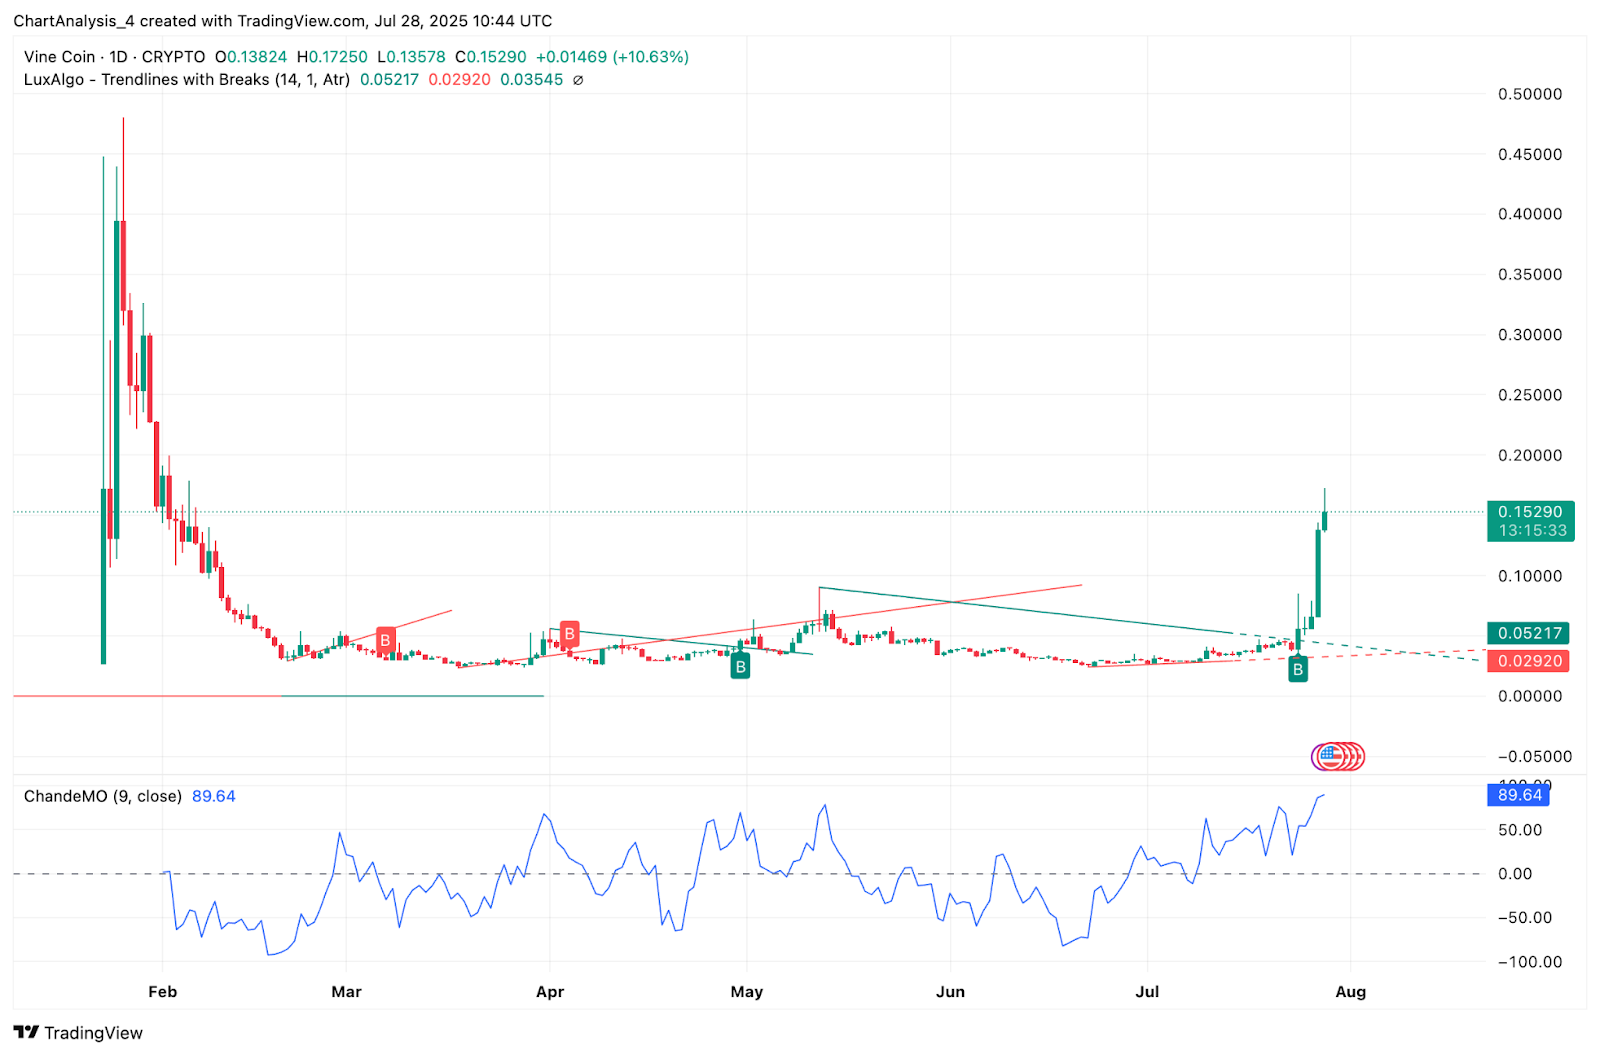
The daily chart confirms a major structure shift. VINE has decisively broken above its March 2025 high near $0.052 and is now trading well into price discovery territory. This is the first time since January that the asset has reclaimed these levels, establishing a new higher high. The Chande Momentum Oscillator (ChandeMO) has surged to 89.6, reflecting extreme bullish strength on the daily trend.
Why Is The Vine Coin Price Going Up Today?
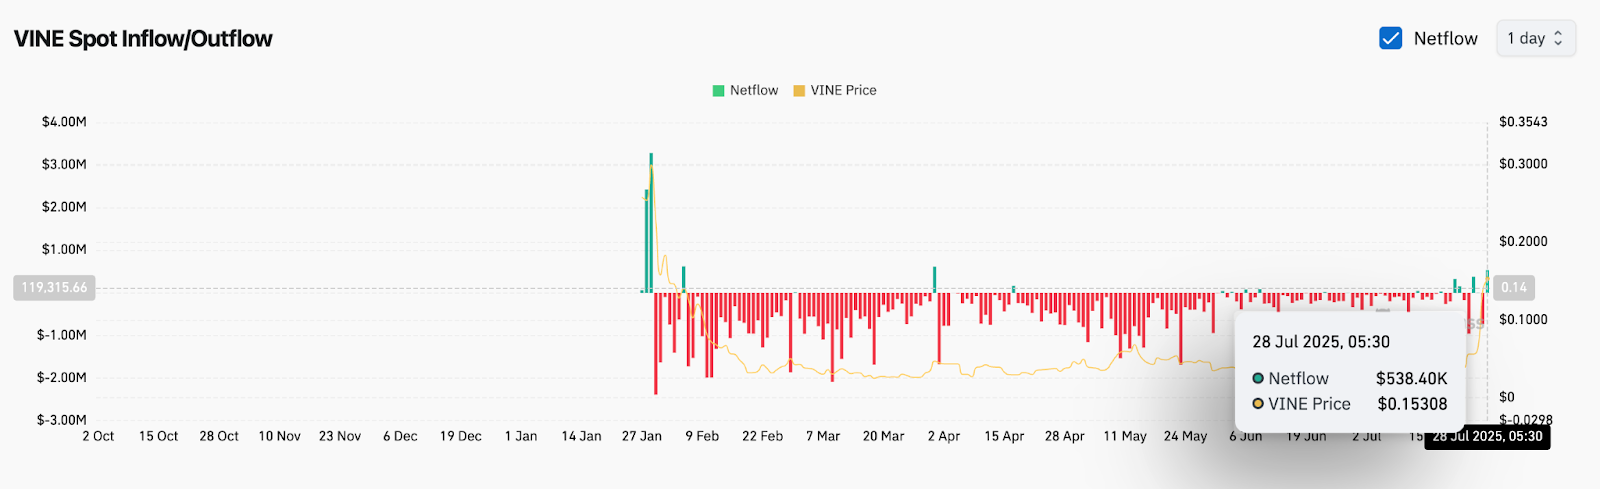
Why Vine Coin price going up today can be attributed to a powerful combination of technical breakout, volume expansion, and fresh capital inflows. Spot netflow data from July 28 shows over $538,000 in daily net inflows, the highest level since February. This comes alongside a dramatic spike in daily volume, confirming accumulation by market participants.
From an intraday view, VINE broke out of a rising triangle around $0.06 with strong follow-through. On-chain metrics show this breakout triggered one of the largest volume candles since January, supported by strong demand and bullish sentiment.
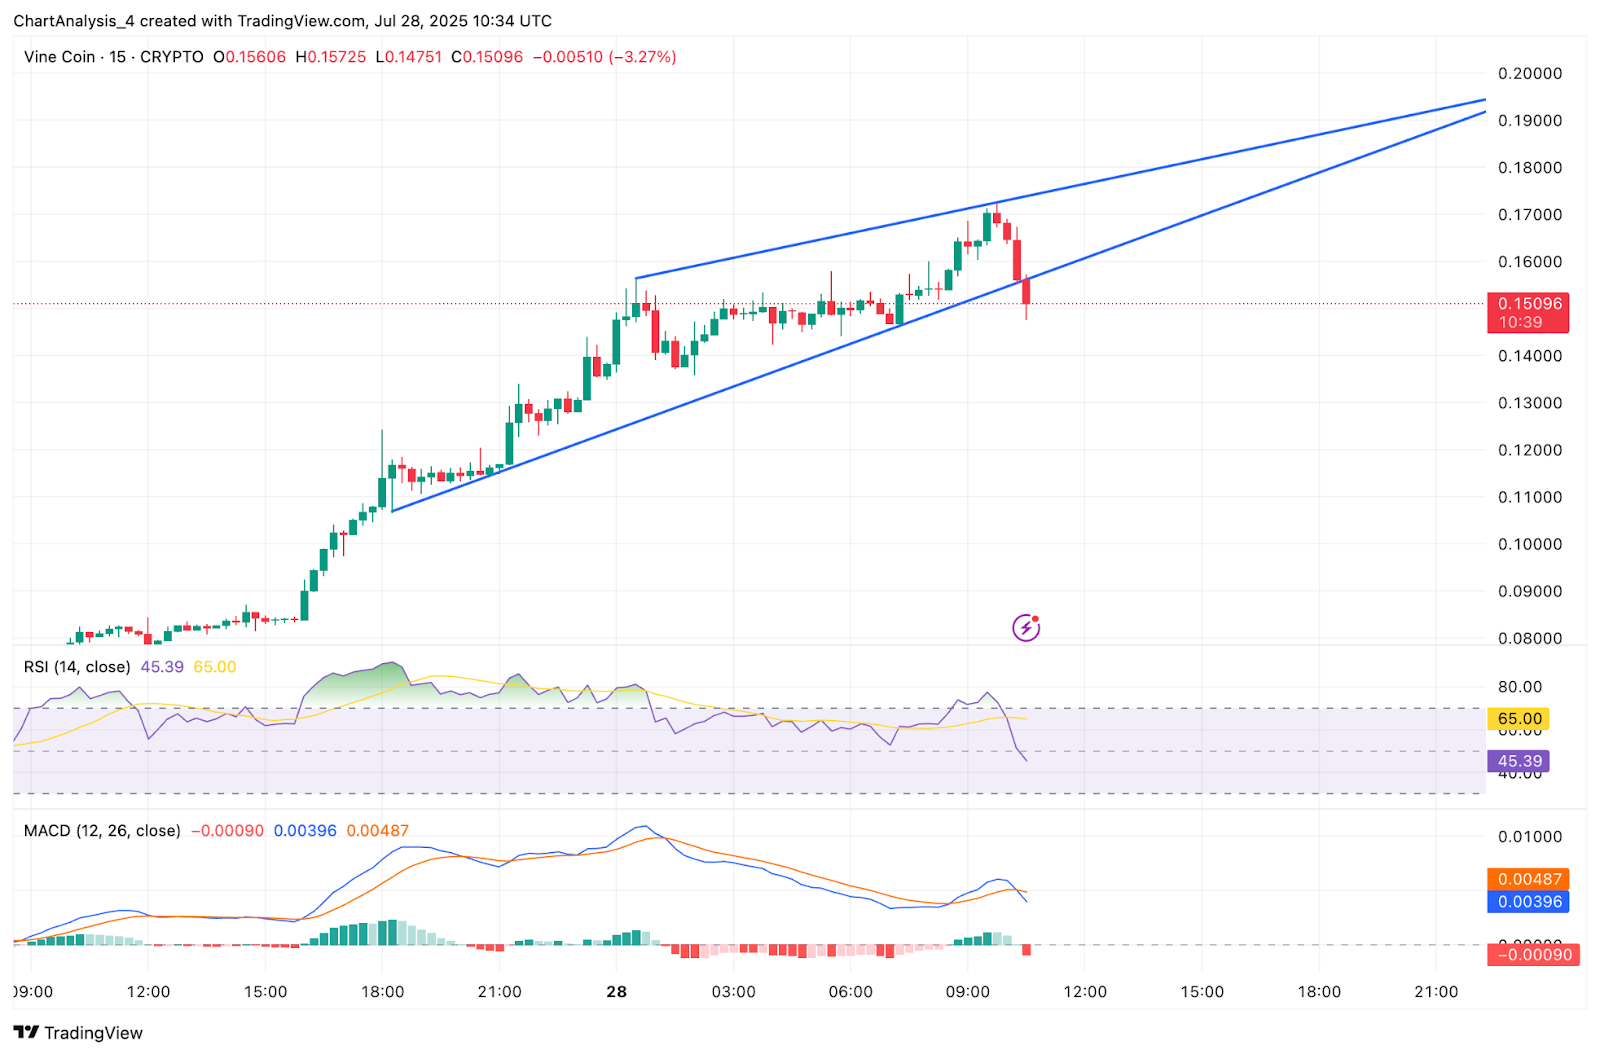
However, the 15-minute chart now shows a rising wedge structure with a breakdown beginning to form. RSI has dropped sharply from overbought territory above 70 down to 45.39, while MACD shows a bearish crossover with histogram weakening. This divergence suggests a near-term pause or retracement could occur before continuation.
Bollinger Bands and Parabolic SAR Hint at Volatility Reversal
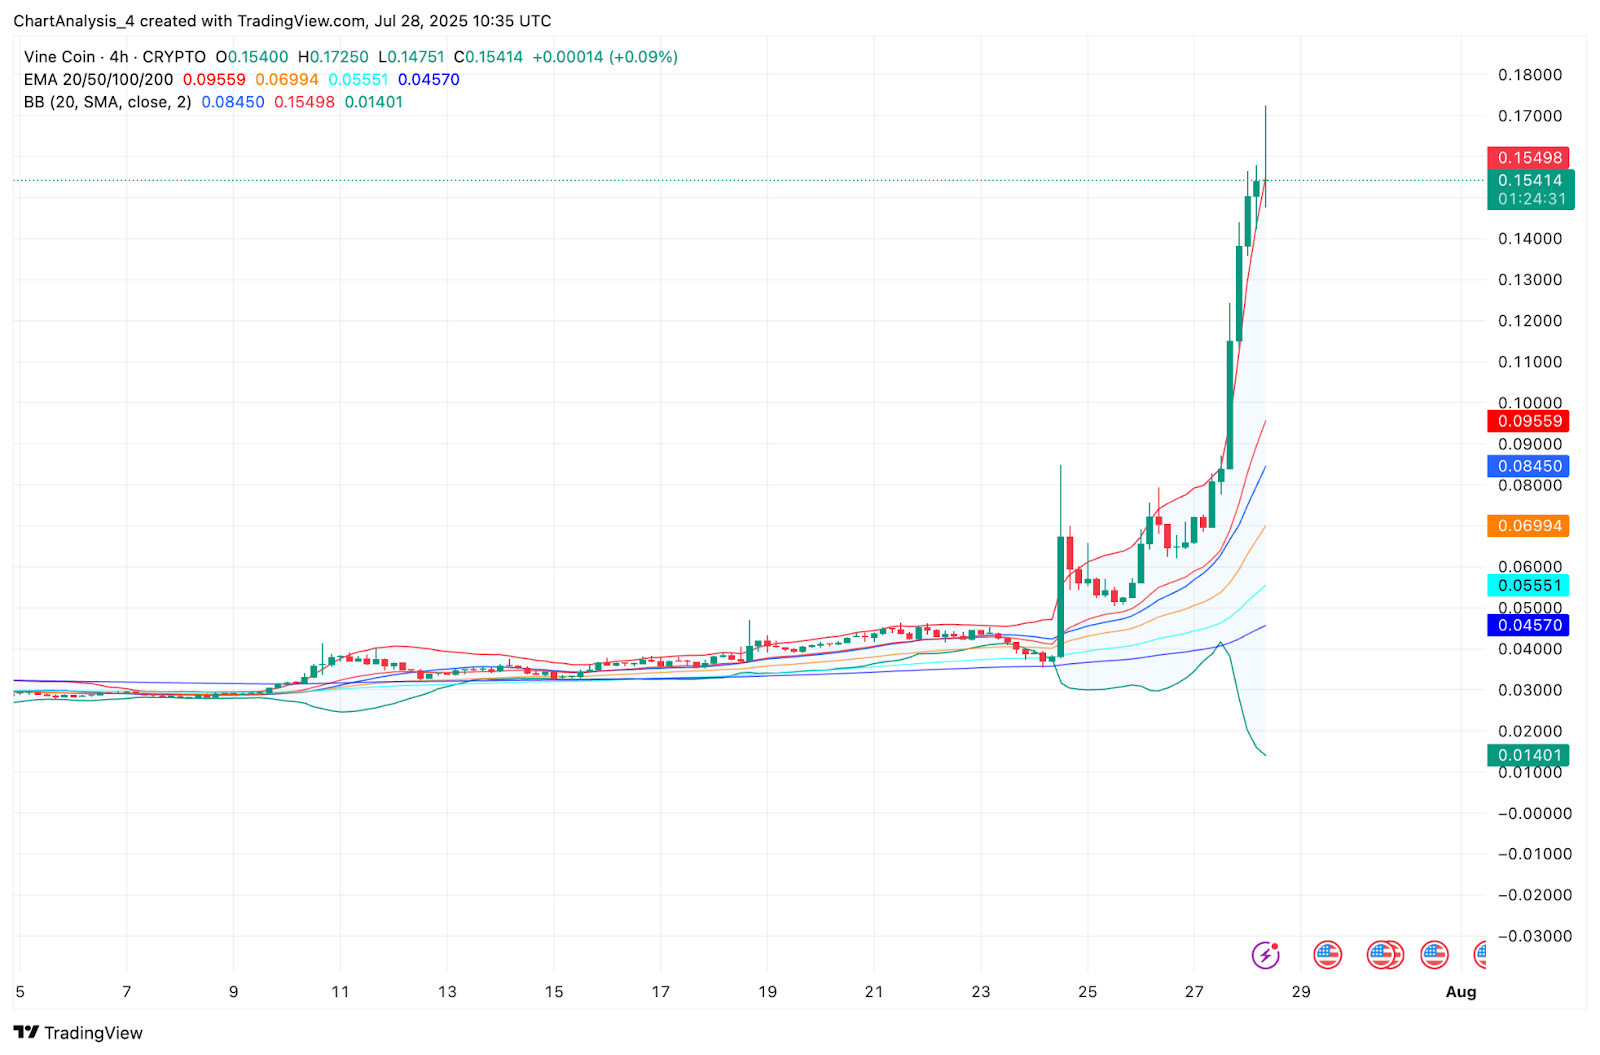
Bollinger Bands on the 4-hour chart show significant expansion, with price piercing far above the upper band near $0.154. This type of expansion often precedes a volatility contraction, especially when paired with short-term exhaustion signals. Additionally, all key moving averages (EMA 20, 50, 100, and 200) on the 4-hour chart are now stacked below price, which is a textbook bullish signal.
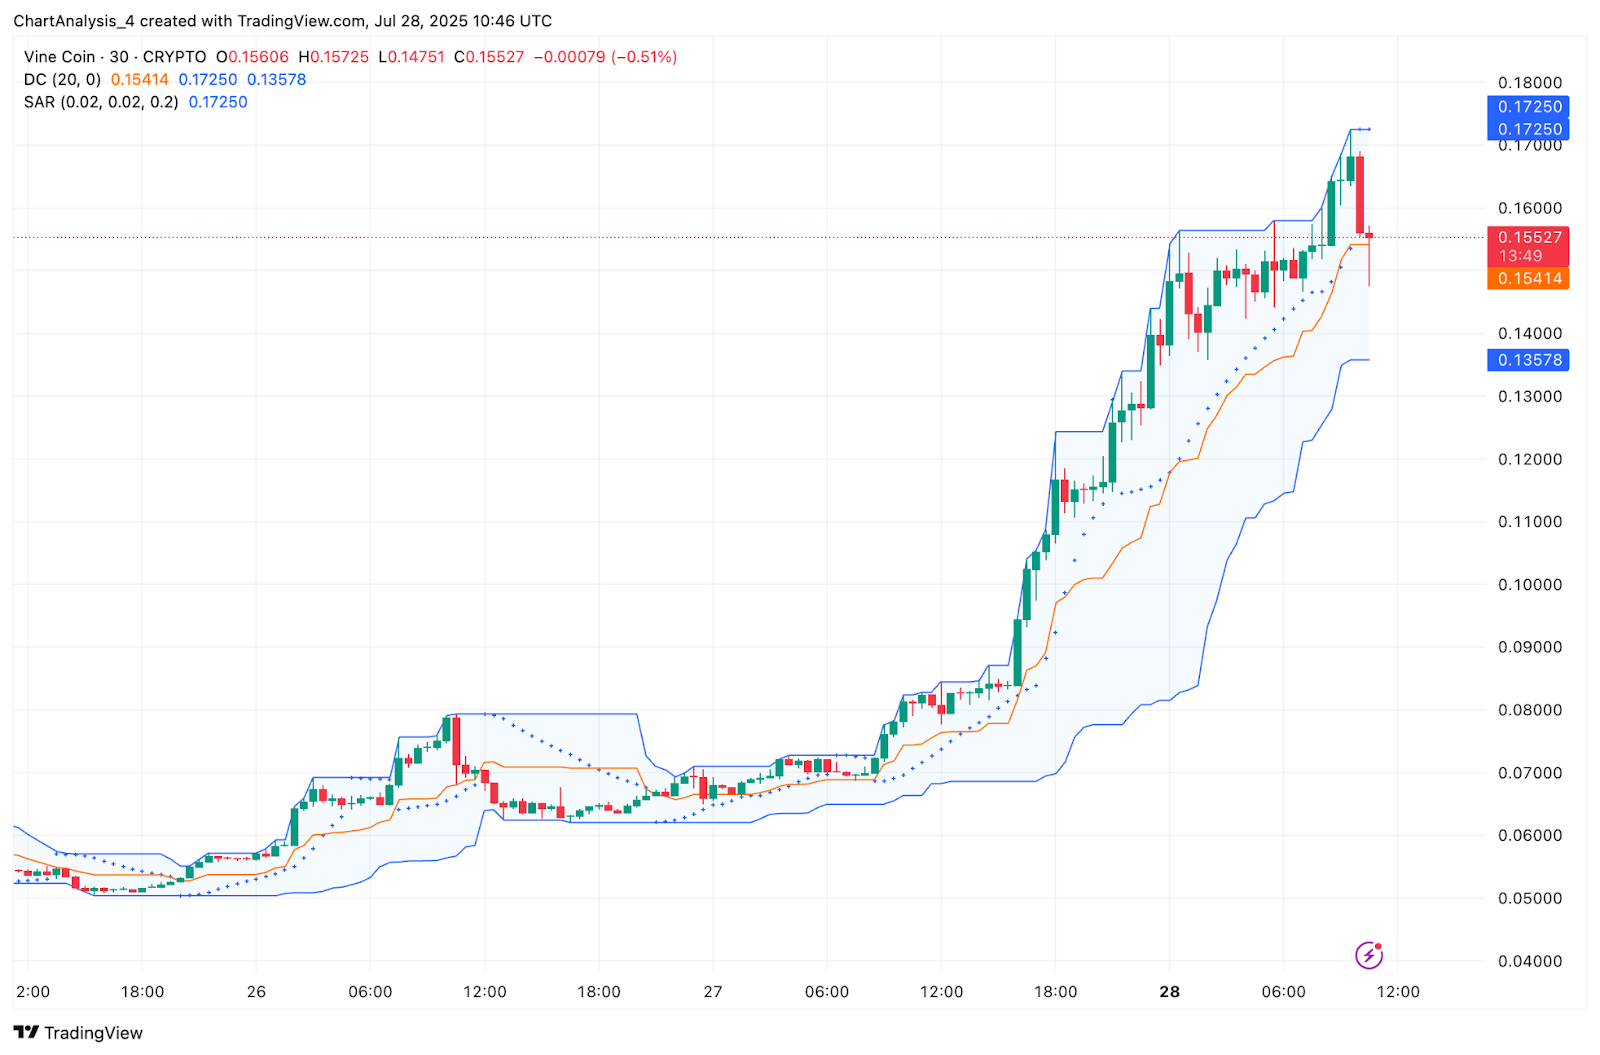
On the 30-minute chart, the Parabolic SAR has flipped above price. This suggests a potential short-term trend reversal. The Donchian Channel also shows price touching the upper bound and failing to extend higher, indicating hesitation after the strong breakout.
While these signals do not confirm a full reversal, they suggest the vertical rally may pause for consolidation. Profit-taking has already begun above $0.17. The next intraday support lies near $0.135 to $0.138, while a deeper correction could retest the $0.120 to $0.125 breakout zone.
VINE Price Prediction: Short-Term Outlook (24H)
The Vine Coin price outlook for the next 24 hours will largely depend on how the $0.150 to $0.153 range holds. If bulls can maintain support above this zone, a retest of the $0.172 intraday high remains likely. A decisive move above this level could extend the rally toward $0.185 to $0.190 next.
However, if short-term weakness continues and price loses $0.150, the first key downside target lies at $0.138, which is support from intraday EMAs. This is followed by the $0.120 level. Given that RSI and MACD are already cooling off, a consolidation range between $0.138 and $0.160 could form before the next major impulse.
Derivatives flow remains limited. The move has been spot-led. Traders should closely watch volume and SAR positioning for breakout confirmation or deeper rejection.
Vine Coin Price Forecast Table: July 29, 2025
| Indicator / Zone | Level / Signal |
| Vine Coin price today | $0.153 |
| Resistance 1 | $0.172 |
| Resistance 2 | $0.185 |
| Support 1 | $0.138 |
| Support 2 | $0.120 |
| RSI (15-min) | 45.39 (cooling from overbought) |
| MACD (15-min) | Bearish crossover forming |
| ChandeMO (1D) | 89.6 (strong momentum) |
| Bollinger Bands (4H) | Expanded, volatility high |
| EMA Cluster (20/50/100/200, 4H) | All below price (bullish alignment) |
| SAR (30-min) | Bearish flip |
| Spot Netflow (July 28) | +$538.4K (bullish capital inflow) |
Disclaimer: The information presented in this article is for informational and educational purposes only. The article does not constitute financial advice or advice of any kind. Coin Edition is not responsible for any losses incurred as a result of the utilization of content, products, or services mentioned. Readers are advised to exercise caution before taking any action related to the company.


