
- Bitcoin clears key $84k resistance, adding weight to historical bull run parallels
- Breakout happens as weekly MA50 holds support & RSI pushes >70, echoing past cycles
- Analysis suggests BTC may be following established multi-year bull ‘blueprint’
Bitcoin demonstrated decisive strength Saturday, pushing firmly above the critical $84,200 resistance zone to trade near about $85,050. This technical breakout appears sustained by consistent buying interest, occurring as market patterns closely resembling previous Bitcoin bull cycles continue to develop.
Market data confirms Bitcoin has overcome significant overhead resistance while maintaining key underlying support levels.On-chain flow indicators simultaneously suggest renewed accumulation and diminished selling pressure on major exchanges.
Why Bitcoin’s Weekly MA50 Support & RSI Action Are Key Signals
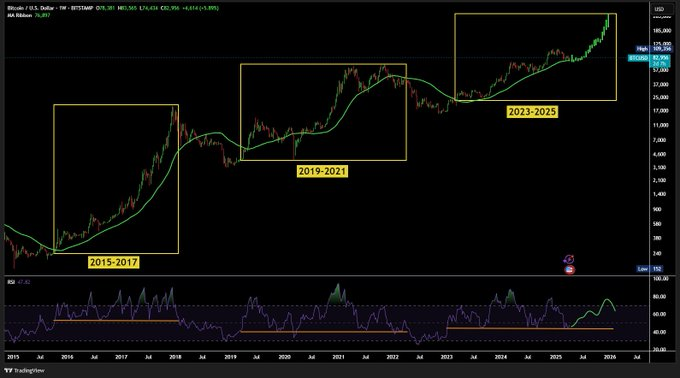
Technical analysis shared by market observer Ash Crypto points out two key indicators that traders monitor closely on Bitcoin’s weekly chart, the 50-week moving average (MA50) and the Relative Strength Index (RSI) near the 44 level.
In past bull markets, the MA50 acted as a reliable support level for Bitcoin, setting the base for sustained rallies. Current price behavior suggests that BTC continues to respect this historical tendency, rendering the MA50 an important reference for assessing trend integrity.
Additionally, the weekly RSI’s defense of the key 44 level, during recent pullbacks mirrors action seen in previous cycles where this zone acted as a springboard.
Related: Bitcoin Nears Halving Sweet Spot, Analysts Eye Breakout Beyond $100K
With the RSI having strongly rebounded from that area and now holding decisively above 70 – a condition often correlated with sustained buying power – the price action appears consistent with past successful cycle patterns.
Echoes of Past Runs: Bitcoin Appears To Follow Historical Script
Bitcoin’s price history reflects a repeated multi-year cycle structure marked by rallies, consolidation phases, and renewed momentum. The ongoing 2023-2025 period appears to follow the same pattern as earlier cycles from 2015-2017 and 2019-2021.
Related: Bitcoin Price Jumps 8% as US Strategic Crypto Reserve Plan Offsets China Stock Concerns
Chart analysis shows that Bitcoin always follows its moving average trend during bull phases, with price action rising once the asset gains support above these technical levels.
With $84k Cleared, What Do Charts Suggest for Bitcoin Next?
BTC currently trades comfortably above this significant moving average zone, reinforcing analysis suggesting continued upward potential.
Adding conviction, the RSI has broken past the 70 zone, a level historically associated with increased bullish momentum. The RSI trendline support signals that buyers continue to dominate, aligning with previous bull market behavior.
At the time of this report, Bitcoin was trading around $85,050. Its total market capitalization stood near $1.68 trillion. Its daily trading volume stands at $29.62 billion, while the circulating supply is recorded at 19.85 million BTC out of a maximum cap of 21 million.
Disclaimer: The information presented in this article is for informational and educational purposes only. The article does not constitute financial advice or advice of any kind. Coin Edition is not responsible for any losses incurred as a result of the utilization of content, products, or services mentioned. Readers are advised to exercise caution before taking any action related to the company.


