
- Litecoin leads in long-term holders, surpassing Bitcoin and Ethereum in retention.
- LTC faces resistance at $86.25, with key support near $83.00 amid price decline.=
- RSI near oversold, MACD signals weakening bearish momentum for potential reversal.
Litecoin (LTC) emerged recently as the leading cryptocurrency based on the percentage of its supply held by long-term holders, showcasing strong investor commitment according to IntoTheBlock data.
Approximately 77.7% of LTC holders have maintained their positions for over 155 days (the typical threshold defining long-term holders in this context).
This places Litecoin slightly ahead of Chainlink (77.5%) and Shiba Inu (75.8%) on this particular metric. This also highlights sustained confidence among its holder base relative to many other altcoins. Ethereum (74.2%) and Bitcoin (73.3%) also show high percentages of long-term holders according to the data set.
Tron (63.2%) and Avalanche (62.9%) show somewhat lower long-term holder figures. Toncoin, however, lags significantly in this specific metric, with only 3.9% of its investors reportedly holding for extended periods. This suggests a potentially more speculative, short-term trading environment for TON compared to Litecoin’s apparent investor loyalty.
Litecoin Price Dips Despite Holder Conviction
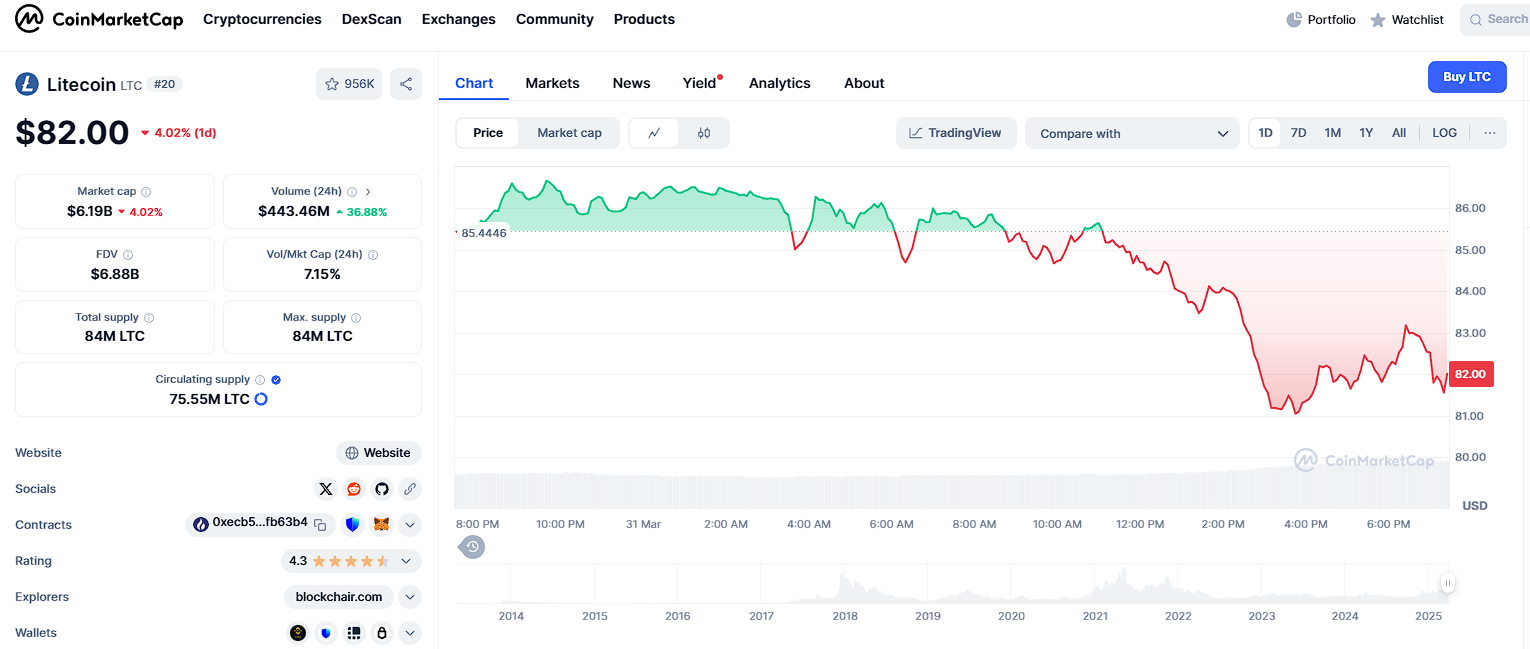
Despite this strong showing in long-term holder conviction, Litecoin’s price has faced downward pressure recently as the broader crypto market moved lower. LTC recorded a decline of 2.56% over the past 24 hours. Currently, it trades at $82, after failing to sustain its position above key near-term resistance levels.
Related: Litecoin ETF From Canary Capital Gets Listed on DTCC: LTC Price Impact Analyzed
The price initially attempted to hold support around the $86.25 level but encountered significant selling pressure there. Selling pressure consequently pushed it to a low near $83 before it stabilized somewhat. Despite a brief recovery attempt since that low, resistance near $85.50 prevented the cryptocurrency from making a stronger sustained upward move.
What Are Key LTC Support and Resistance Levels?
Litecoin currently faces crucial immediate resistance near $85.50. Above that lies the recent high around $86.25. Overcoming these overhead barriers is necessary for any sustained bullish recovery attempt.
On the downside, the $83.00 level now serves as an important immediate support area, where some buying activity was previously observed. If this level breaks under continued selling pressure, LTC could see further declines toward the next technical support zone identified between $82.00 and $82.50.
A decisive move below this area might trigger increased selling pressure in the short term.
Technical Indicators Signal Weak Momentum
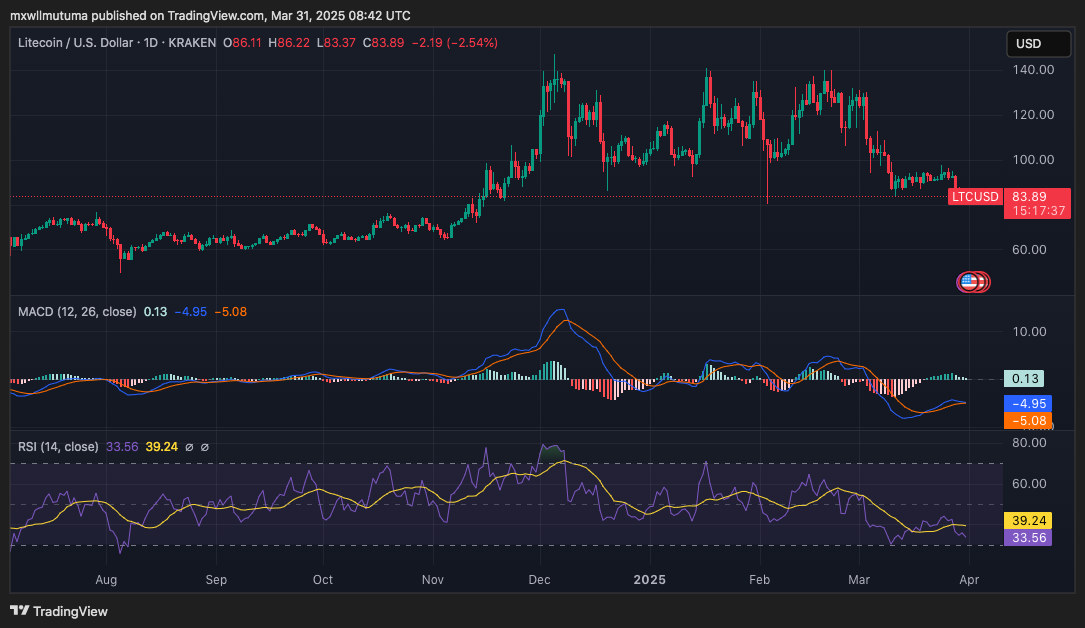
Several technical indicators currently highlight Litecoin’s weakening short-term price momentum. The Relative Strength Index (RSI) on the daily chart stands near 33.56. This reading approaches technically oversold territory (typically considered below 30).
Although an RSI below 30 sometimes signals a potential price reversal might be near, LTC is not yet firmly within that zone.
Related: Litecoin Seen Leading Altcoin ETF Race as SEC Approval Odds Weighed for Dogecoin, XRP, and Others
The Moving Average Convergence Divergence (MACD) indicator also reflects generally bearish conditions at present. The MACD line sits just below its signal line. However, the histogram shows a slight positive value (0.13), which could indicate that the recent downward momentum may be slowing.
If the MACD line decisively crosses above the signal line, confirming this hint, a short-term bullish reversal could occur.
Disclaimer: The information presented in this article is for informational and educational purposes only. The article does not constitute financial advice or advice of any kind. Coin Edition is not responsible for any losses incurred as a result of the utilization of content, products, or services mentioned. Readers are advised to exercise caution before taking any action related to the company.


