
- WIF price rises, but trading volume dips
- Whale activity boosts sentiment, but technical indicators mixed
- Cautious market outlook due to conflicting signals
The cryptocurrency market experienced activity in the past 24 hours, with Dogwifhat (WIF) surging more than 3.5% to $2.70. The token reached intraday highs of $2.72 and lows of $2.44. However, trading volume for WIF has dropped by 38.26%, reaching $536.5 million. This decline suggests a potential shift in market sentiment in the coming hours.
Investor optimism has been boosted by recent whale activity involving WIF. According to on-chain analytics platform Lookonchain, a large investor made significant purchases of the token. This investor opened a new wallet and transferred 1.83 million USDC from Coinbase to facilitate the WIF purchases. They have used approximately 606,000 USDC to acquire 227,896 WIF tokens at an average price of $2.66 each.
Data from Coinglass shows that Open Interest (OI) for WIF derivatives has declined by 3.77%, totaling $327.40 million. This decrease in OI suggests a reduction in the number of open contracts, indicating lower trader participation.
Technical analysis for the past 24 hours reveals that the WIF token price is consolidating. The Alligator indicator’s three lines are intertwined, suggesting a lack of strong directional momentum. This indicates a period of equilibrium where buyers and sellers are balanced, leading to stable price movements.
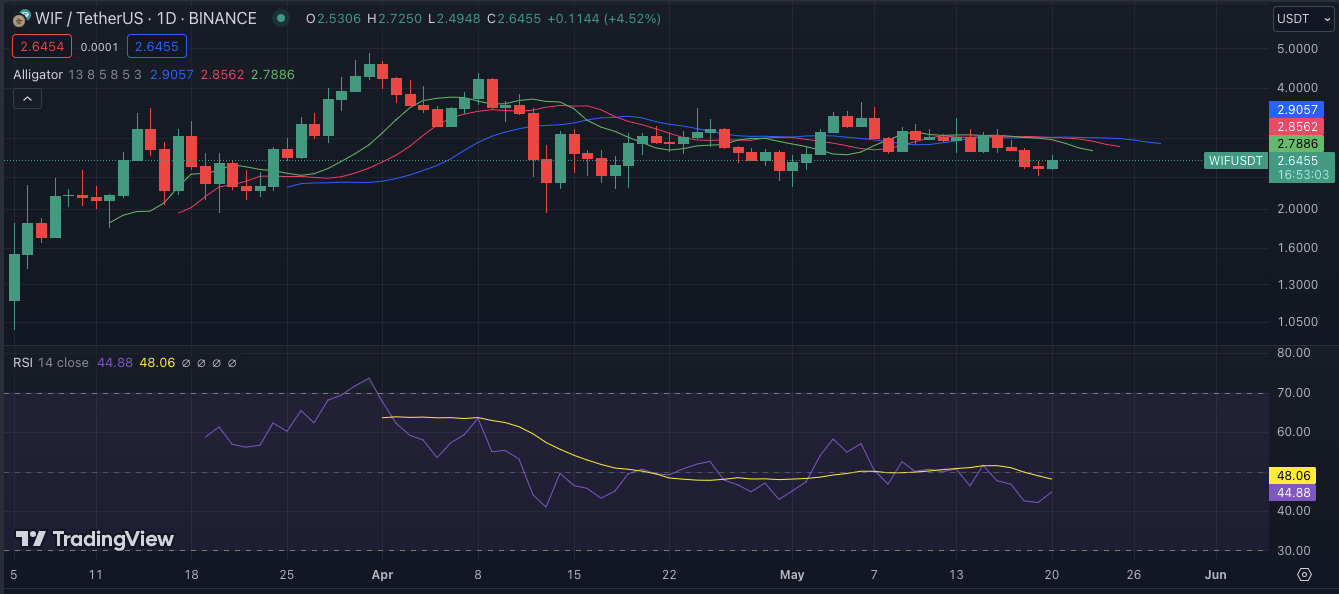
WIF/USD 24-hour price chart source: TradingView
The Relative Strength Index (RSI) currently sits at 45.78, hovering near the midline of 50. This signifies a neutral market without strong bullish or bearish dominance. This level of RSI suggests a balanced market where neither buyers nor sellers have a clear advantage.
The 4-hour technical analysis presents intriguing movements for the WIF token price, as reflected by the Moving Average Convergence Divergence (MACD) indicator. The MACD line is approaching a potential crossover above the signal line, hinting at a possible increase in bullish momentum. This positive divergence suggests that buyers are gradually gaining strength, potentially leading to a near-term price increase.
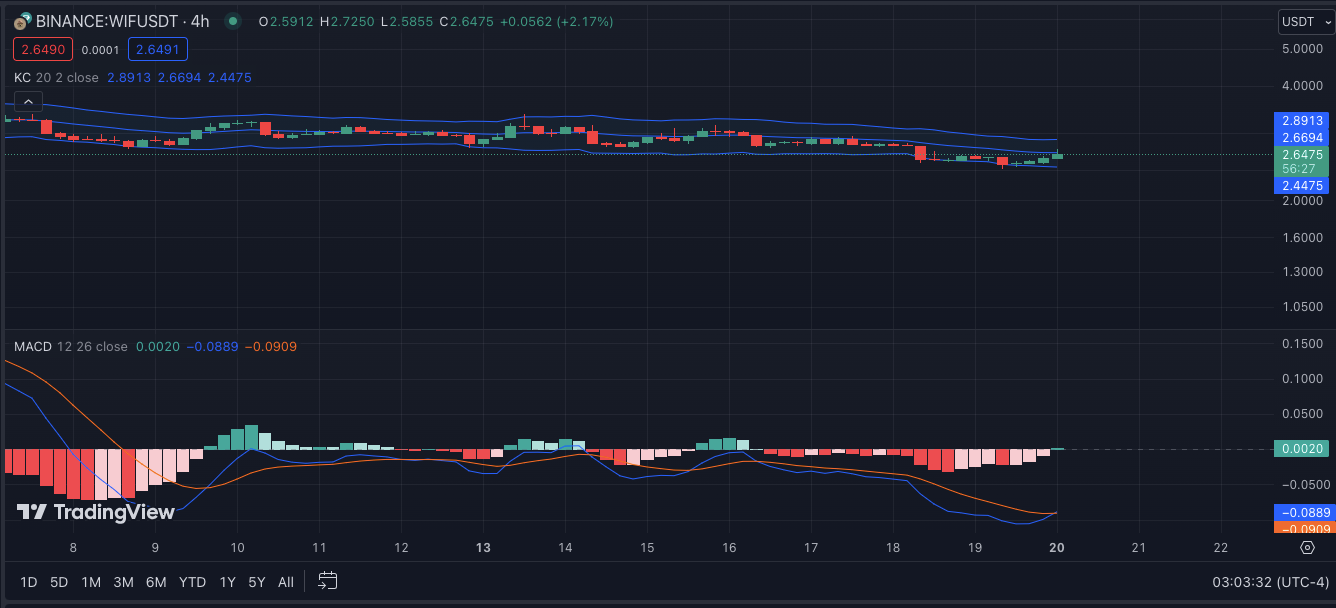
WIF/USD 4-hour price chart source: TradingView
Furthermore, the Keltner Channels, which measure volatility and price trends, show the price of WIF hovering near the middle of the channel. This suggests a balanced market condition without significant bullish or bearish bias.
To conclude, while WIF’s price has increased, the mixed signals from trading volume and technical indicators suggest a cautious market outlook.
Disclaimer: The information presented in this article is for informational and educational purposes only. The article does not constitute financial advice or advice of any kind. Coin Edition is not responsible for any losses incurred as a result of the utilization of content, products, or services mentioned. Readers are advised to exercise caution before taking any action related to the company.

 Price Prediction: Canton Eyes Key Break After Market Activity Spike")


