
- XRP has formed a large, multi-month descending wedge, a classic bullish breakout pattern.
- Analysts note the price is nearing the pattern’s apex, suggesting a major rally is imminent.
- The technical structure suggests XRP is building momentum for a sustained upside move.
After months of steady consolidation, XRP has reached a critical inflection point, according to multiple technical analysts. A massive descending wedge pattern on the daily chart has compressed the token’s price into an increasingly tight range, leading to a consensus view that a significant, high-volatility move is now imminent.
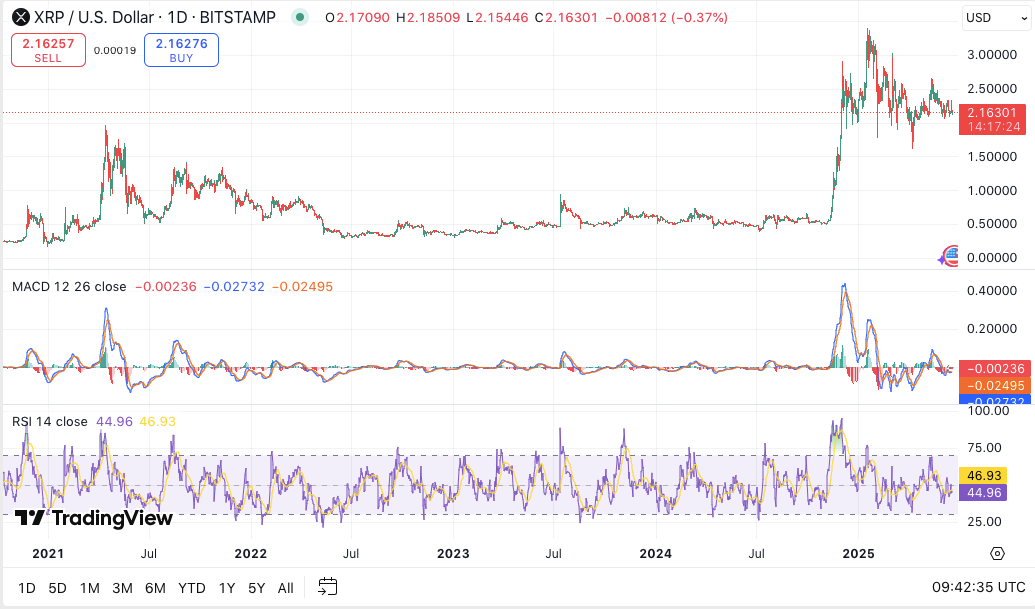
While XRP has seen short-term declines, many market watchers agree that a breakout or breakdown is now imminent. The coin is currently trading at $2.16, showing slight losses on the day and the week.
However, the pattern’s structure and the timing of the current setup suggest a high-probability shift is near. Consequently, all eyes are on XRP’s next steps as it tests historical support and resistance levels.
Related: XRP Price Prediction: Why XRP Price Going Down Today?
A ‘Monster’ Wedge Nears Its Conclusion
Analyst AltcoinGordon has highlighted a large descending wedge forming on the XRP/USDT daily chart. This wedge, often referred to as a “monster,” has compressed price tightly between consistent lower highs and solid support between $0.50 and $0.55. Historically, similar patterns often resolve in powerful breakouts.
Resistance around the $0.70–$0.75 range marks a key level to watch. If the price breaks above that zone, XRP could move quickly toward higher targets. Volume has also been decreasing during this consolidation, which typically precedes high-volatility breakouts. Key support near $0.48 continues to hold, reinforcing the idea that the wedge may resolve to the upside.
‘Time Is Up’: The Case for an Imminent XRP Move
CasiTrades emphasized that the consolidation phase is over. The price action has reached the apex of the structure, and time is up. The market now faces only two outcomes: an immediate breakout or a final liquidity sweep down to key levels. Support levels at $2.01, $1.90, and $1.55 may still be tested. These zones are seen as momentum-building areas, not bearish signals.
Additionally, Wednesday’s timing is important. Mid-week shifts often lead to sudden reversals, especially after long squeezes. The current setup combines technical tension with external pressures, including rising global uncertainty.
Momentum Indicators Advise Cautious Optimism for XRP
Related: The $10,000 XRP Debate: Analyst Says It’s “Necessary,” Critics Call It Impossible
The MACD shows a bearish crossover, hinting at short-term downside risk. The histogram signals fading bullish momentum. RSI currently sits around 44.82, suggesting slight bearish bias but not yet oversold. Past RSI spikes have aligned with local tops, offering a guide for potential future moves.
Disclaimer: The information presented in this article is for informational and educational purposes only. The article does not constitute financial advice or advice of any kind. Coin Edition is not responsible for any losses incurred as a result of the utilization of content, products, or services mentioned. Readers are advised to exercise caution before taking any action related to the company.


