
- XRP eyes a breakout above $2.27 resistance for sustained bullish momentum.
- Market sentiment remains positive, but low trading volume signals possible consolidation.
- Technical indicators hint at a potential bullish reversal despite weak momentum.
XRP is defying the odds. Despite mixed technical signals, the digital asset shows significant volatility, initially dipping to an intraday low before regaining strength, and has shown strong upward momentum in the latest trading session, reaching $2.26 with a 3.63% daily increase.
Investors are closely monitoring the price action as market sentiment leans towards a bullish outlook, and is now trading at $2.29. However, key resistance levels must be broken for sustained upward movement.
XRP’s Price: Key Levels for March 14
XRP’s price chart indicates volatility, with an early decline followed by a strong recovery. The lowest level recorded was around $2.18, which acted as a critical support area before buyers regained control.
Conversely, the price peaked at $2.27, which is acting as a short-term resistance level. Despite price fluctuations, XRP maintains an overall bullish outlook, supported by steady gains and growing market confidence.
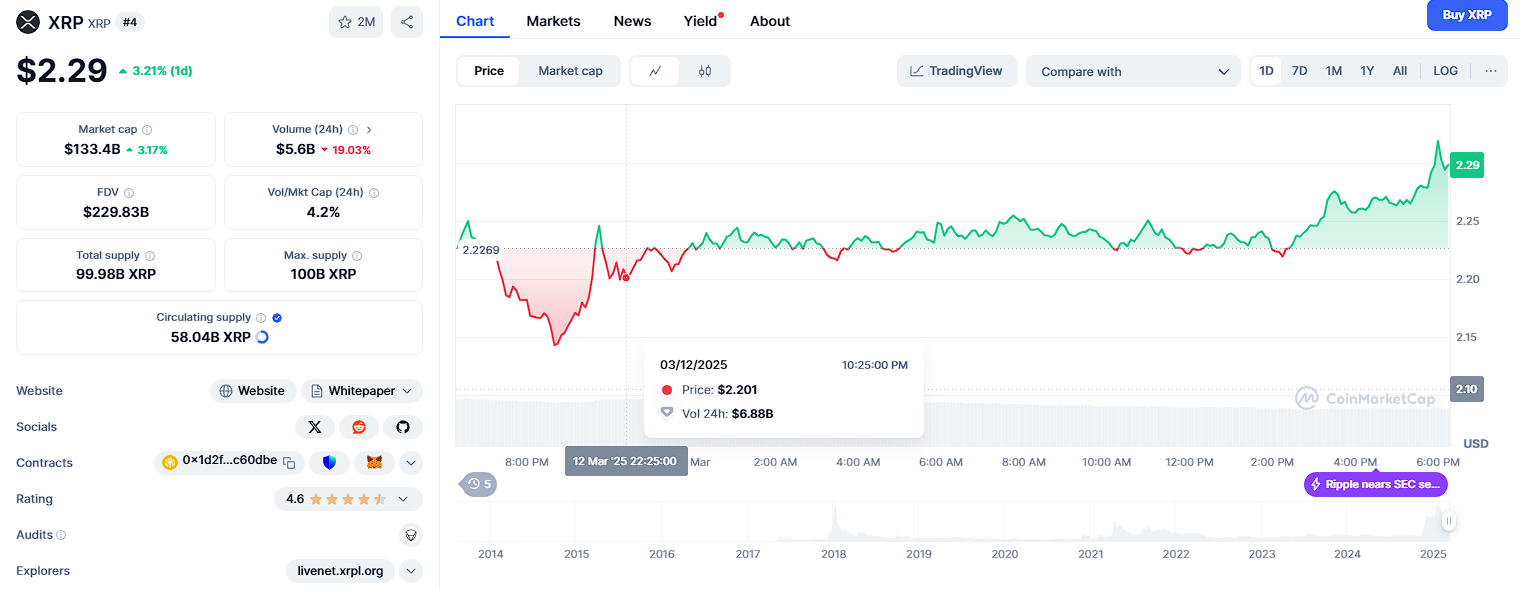
Trading volume has declined by 16.02% over the past 24 hours, suggesting a possible consolidation phase despite the rising price. The market capitalization increase, matching the 3.63% price gain, highlights growing investor interest. However, the drop in trading activity raises concerns about the sustainability of this upward momentum.
Support and Resistance Zones to Watch
Price action analysis highlights crucial support and resistance zones that traders should monitor. The $2.18–$2.20 range has acted as a reliable support area, preventing further downside movement.
Should selling pressure increase, XRP may test the next lower support near $2.15. Staying above these support zones is critical for bullish continuation.
On the upside, XRP faces immediate resistance at $2.27, the highest level recorded during this trading session. A decisive breakout above this resistance could pave the way for a move toward $2.30. This psychological barrier could either trigger further buying or act as a profit-taking zone, leading to price consolidation.
Technical Indicators: Mixed Signals
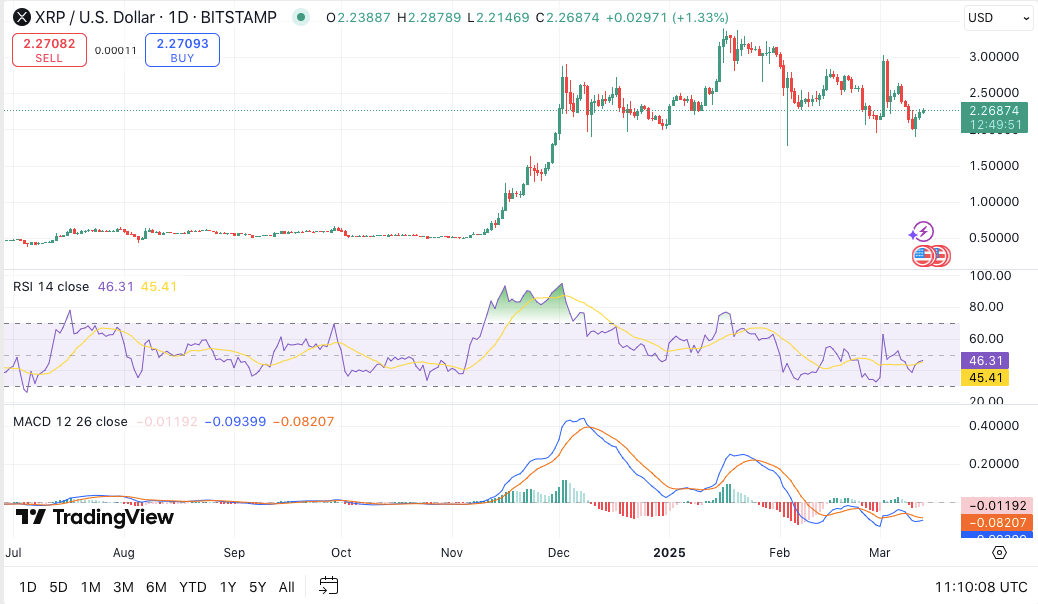
XRP’s Relative Strength Index (RSI) currently stands at 46.38, while the signal line is slightly lower at 45.41. An RSI below 50 suggests weak bullish momentum, indicating the market remains neutral with a slight bearish tilt. However, if the RSI crosses above 50, it could signal a stronger uptrend.
The Moving Average Convergence Divergence (MACD) indicator is currently below zero, reflecting bearish momentum. Despite this, the MACD line is crossing above the signal line, hinting at a potential bullish reversal. This shift could indicate growing buyer interest and an upcoming upward push.
XRP Forecast: Bullish Long-Term
Looking ahead, Coincodex analysts project XRP to trade within a range of $2.72 to $2.97 by the end of 2025. If the digital asset maintains its bullish trajectory, it could achieve an average price of $2.82, reflecting a 24.62% increase from current levels.
Investors who enter at today’s prices could see potential gains of approximately 31.40% if XRP meets this projection.
Disclaimer: The information presented in this article is for informational and educational purposes only. The article does not constitute financial advice or advice of any kind. Coin Edition is not responsible for any losses incurred as a result of the utilization of content, products, or services mentioned. Readers are advised to exercise caution before taking any action related to the company.


 Price Prediction: Canton Eyes Key Break After Market Activity Spike")

