
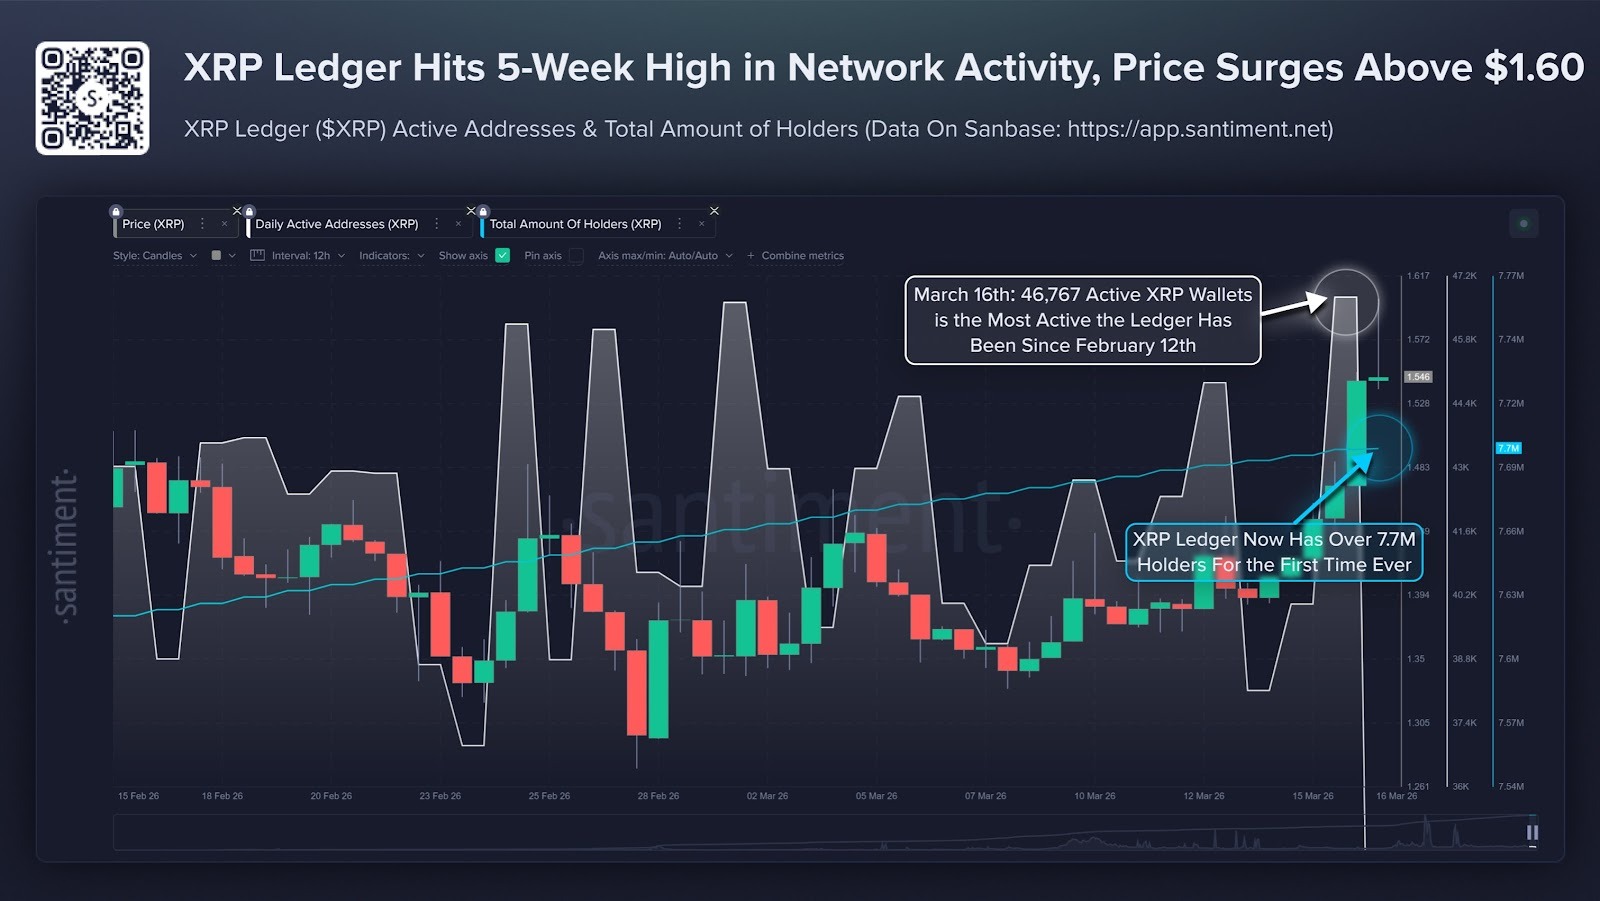
- XRP holder count surpasses 7.7 million for the first time since launch.
- Daily active addresses hit a five-week high as price jumps above $1.60.
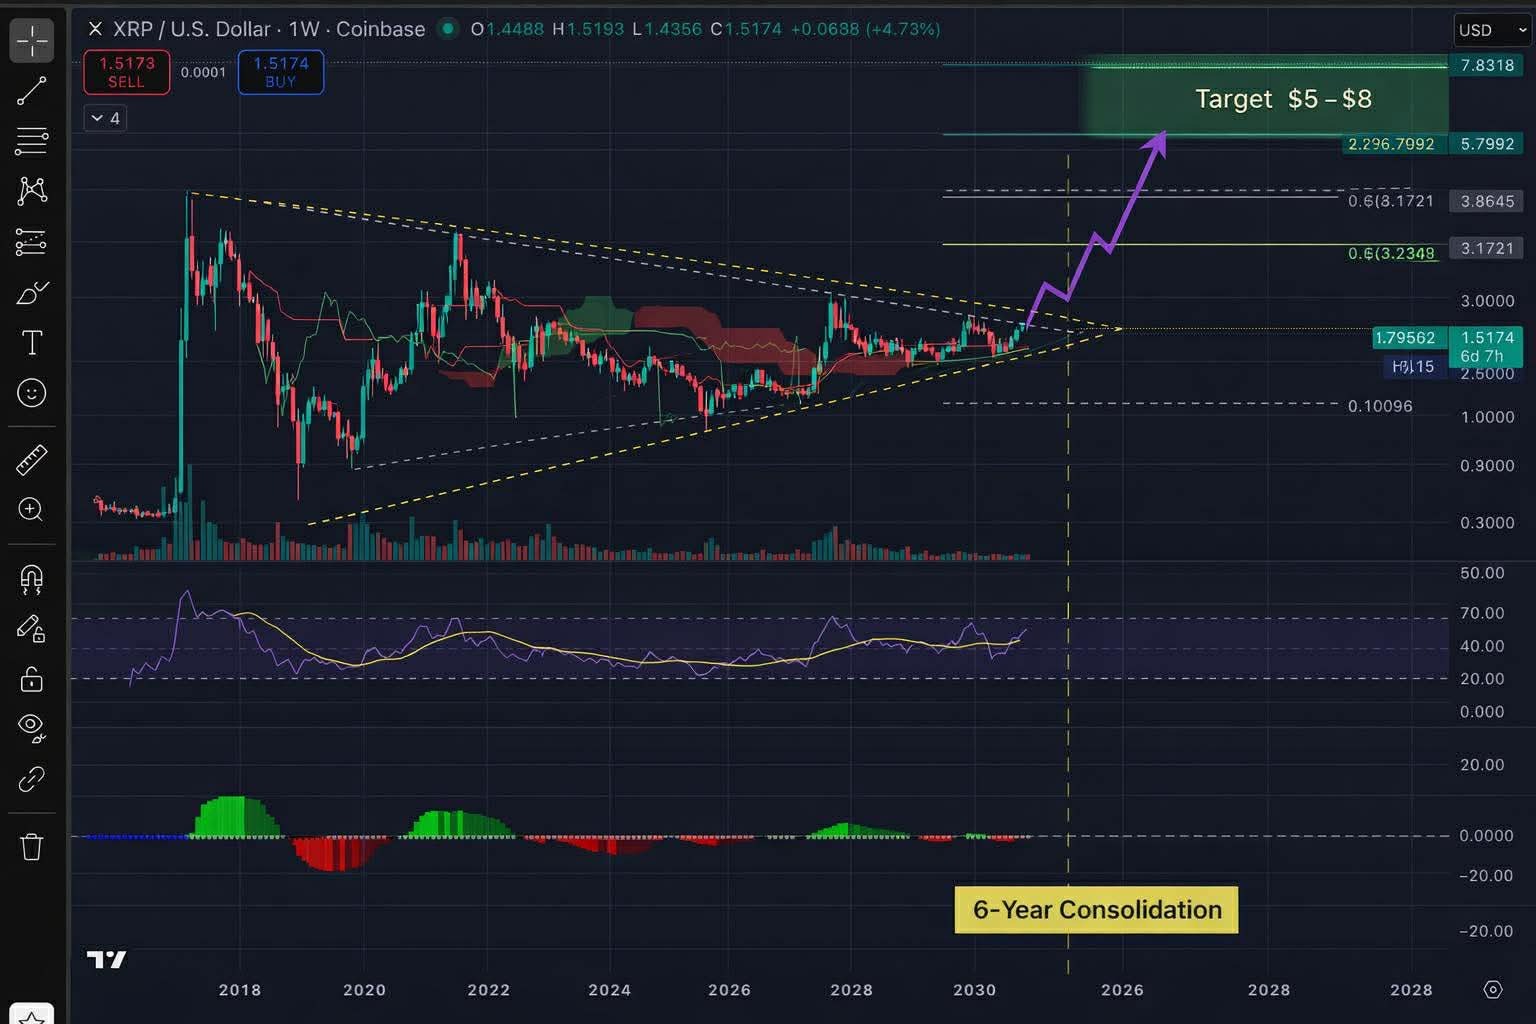
- Analysts point to a long-term chart pattern targeting $3.17 and potentially $5–$8.
XRP has reached a record 7.7 million holders as network activity rises. The milestone comes as the token’s price climbs above $1.60 after a recent surge. Analysts are also watching a long-term chart pattern that could signal a breakout.
XRP Network Growth Hits Historic Milestone
Data from blockchain analytics firm Santiment shows that the XRP Ledger now has more than 7.7 million non-empty wallets. It marks the first time the network has reached that level since its launch more than 13 years ago.
A non-empty wallet means the address holds some amount of XRP. Rising wallet numbers indicate adoption and participation in a blockchain network.
Network activity also increased. On Monday, the ledger recorded 46,767 active addresses. Santiment said this was the highest level in five weeks.
The rise in activity coincided with a price move. XRP climbed about 14% over a 48-hour period and broke above $1.60. At press time, the price retraced slightly, trading at $1.54 after a 3.6% uptick over the past day. This surge extended XRP’s weekly rally to 11%.
Higher active addresses suggest more users are sending or receiving tokens. In many cases, increased on-chain activity appears alongside periods of stronger market momentum.
Analysts Focus on Long-Term Price Compression
While network metrics show growth, some analysts are also focusing on XRP’s long-term price structure. In a separate development, market analyst Diana recently highlighted a multi-year wedge pattern on the XRP chart. The pattern shows the token trading inside narrowing trend lines since the January 2018 market peak.
This structure indicates what traders often call “price compression”. In this phase, the market moves within a tightening range as buyers and sellers compete for control. Technical analysts often watch such formations closely. When a wedge pattern reaches its final stages, it can lead to a stronger breakout in either direction.
The first target appears around $3.17. A higher resistance level sits near $3.54, close to the 2018 all-time high of $3.84. XRP will need to surge by 149% to reach its previous high.
Optimistically, if XRP breaks above this high and momentum expands, the chart points to a broader target range between $5 and $8.
Momentum Indicators Show Gradual Shift
Other indicators on the weekly chart suggest momentum may be building. The relative strength index (RSI) shows a gradual upward trend.
Meanwhile, the moving average convergence divergence (MACD) indicator reflects shifting momentum after extended consolidation. Such signals do not guarantee a breakout. However, they often indicate that market pressure is building as traders position for the next trend.
Related: XRP Community Divided Over Ripple’s Token Sales and Corporate Strategy
Disclaimer: The information presented in this article is for informational and educational purposes only. The article does not constitute financial advice or advice of any kind. Coin Edition is not responsible for any losses incurred as a result of the utilization of content, products, or services mentioned. Readers are advised to exercise caution before taking any action related to the company.


