
- XRP price tests key ‘Golden Pocket’ Fibonacci support zone near $2.10-$2.15
- Deeply oversold RSI (~21) for XRP sparks speculation about a potential bounce
- LINK, HBAR, TIA, TEL also test critical support levels amid market caution
As the broader market consolidates, analysts are closely watching five specific tokens: XRP, Chainlink (LINK), Hedera (HBAR), Celestia (TIA), and Telcoin (TEL), as each displays distinct chart patterns near key inflection points. This report breaks down the current technical picture for these assets.
XRP Analysis: Testing Critical $2 Support Zone?
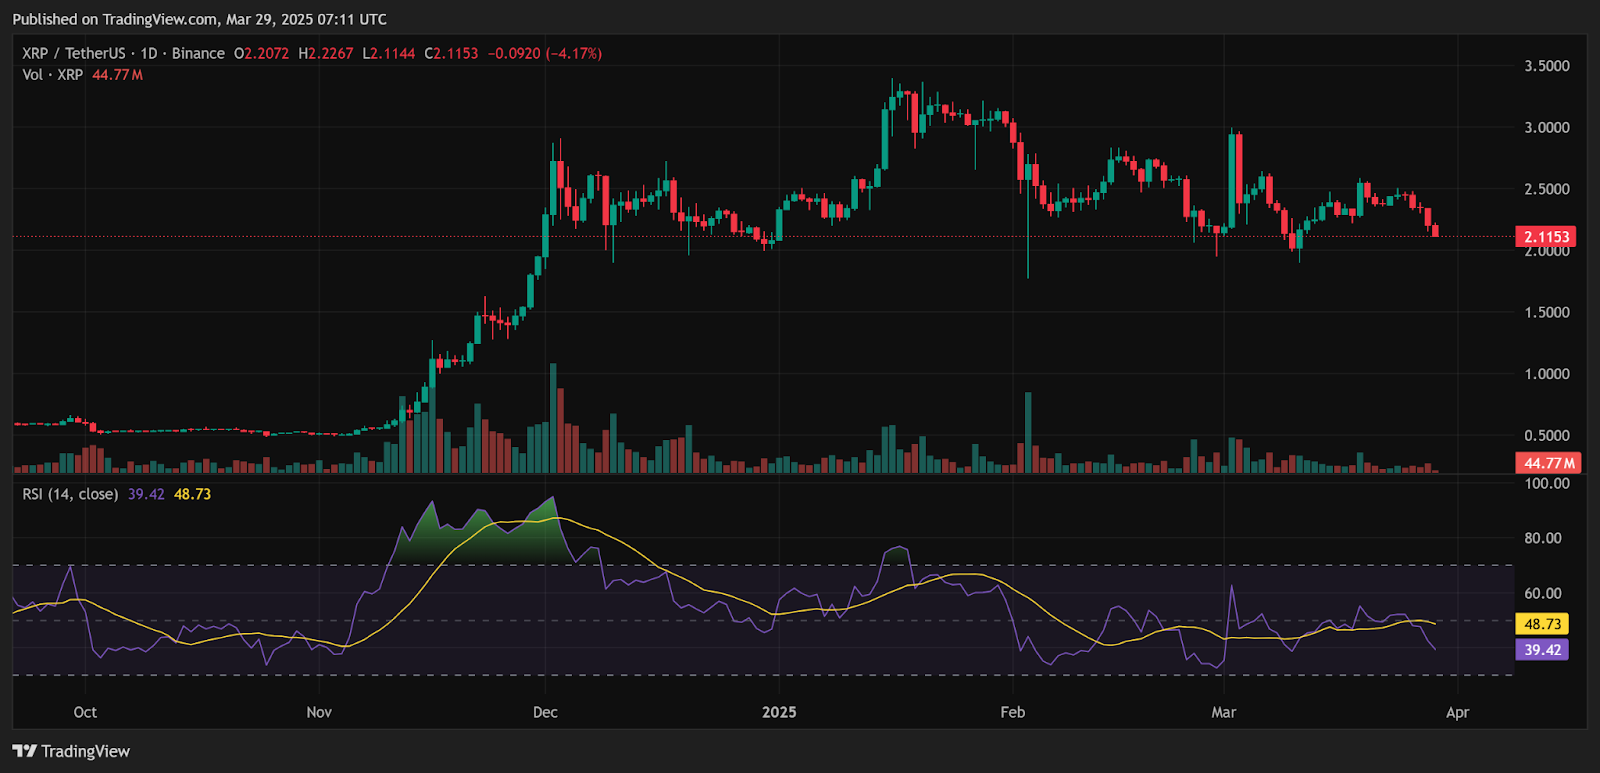
XRP entered a bearish phase recently. Its Relative Strength Index (RSI) fell below 40, nearing oversold territory. The token lost the crucial $2.34 price level and subsequently broke below its 20-day Exponential Moving Average (EMA) – currently around $2.17 – confirming short-term bearish control. At press time, XRP trades near $2.12.
The $2 psychological level now acts as critical nearby support. If buyers fail to defend this zone, a deeper price correction could follow towards lower historical support levels like $1.95.
Related: Major Liquidity Event: $320M+ Token Unlocks To Reshape Altcoin Market This Week
Chainlink (LINK): Can It Reclaim $14 After Support Break?
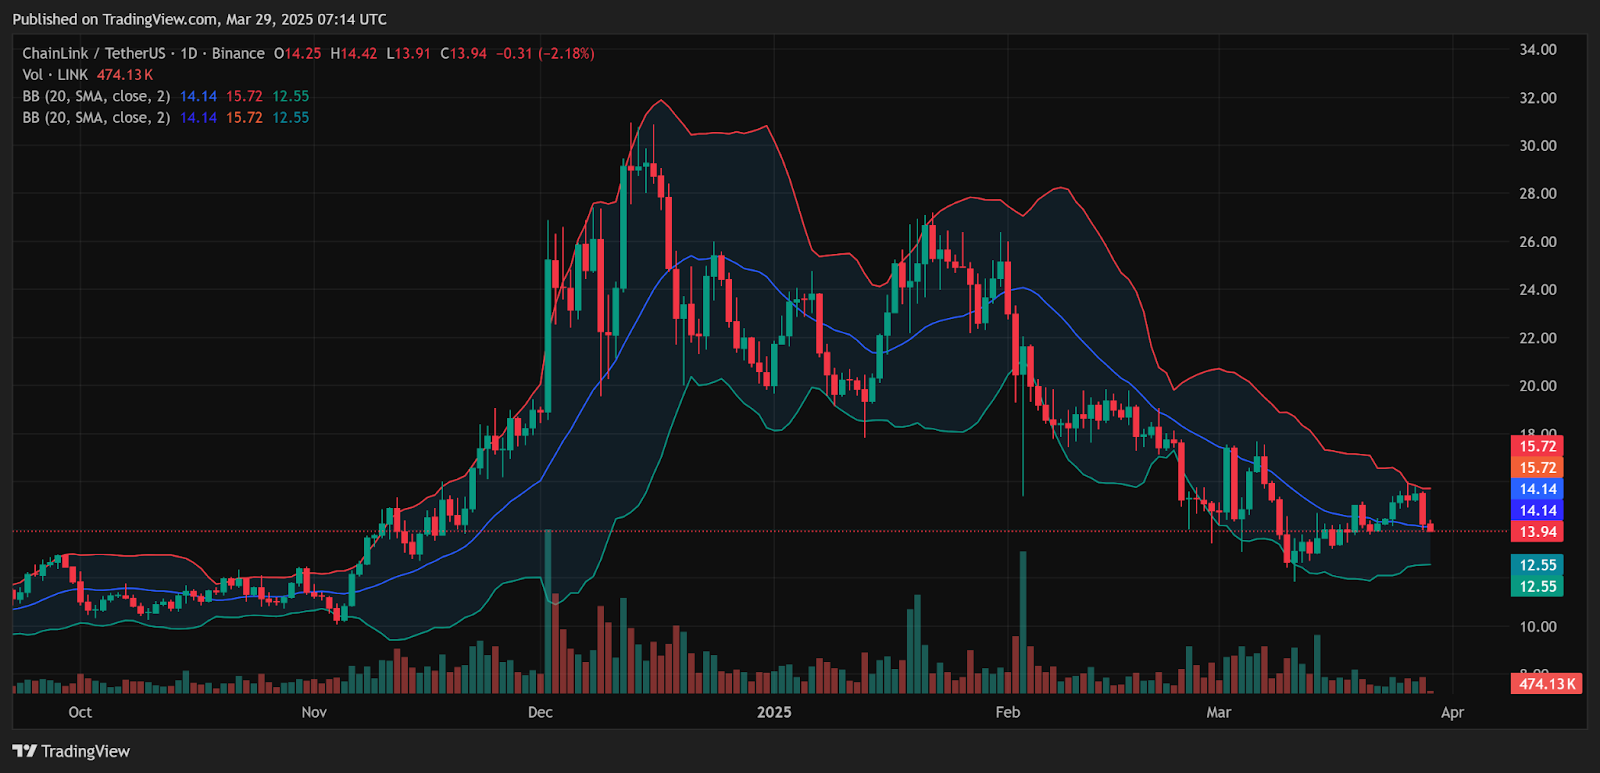
Chainlink (LINK) lost the $14 price level earlier and now trades around $13.98. Recent price action shows LINK breaking below support at the middle Bollinger Band (near $14.14). Widening Bollinger Bands currently indicate rising volatility for the asset. The next significant technical support lies at the lower Bollinger Band, situated near $12.55.
For a convincing bullish reversal, LINK first needs to reclaim the mid-band around $14.14 before potentially targeting higher resistance levels.
Related: XRP ETF News, ETH Upgrade, AI Hype: April Looks Big for These 4 Altcoins
Hedera (HBAR): Hovering Near Key Fibonacci Support
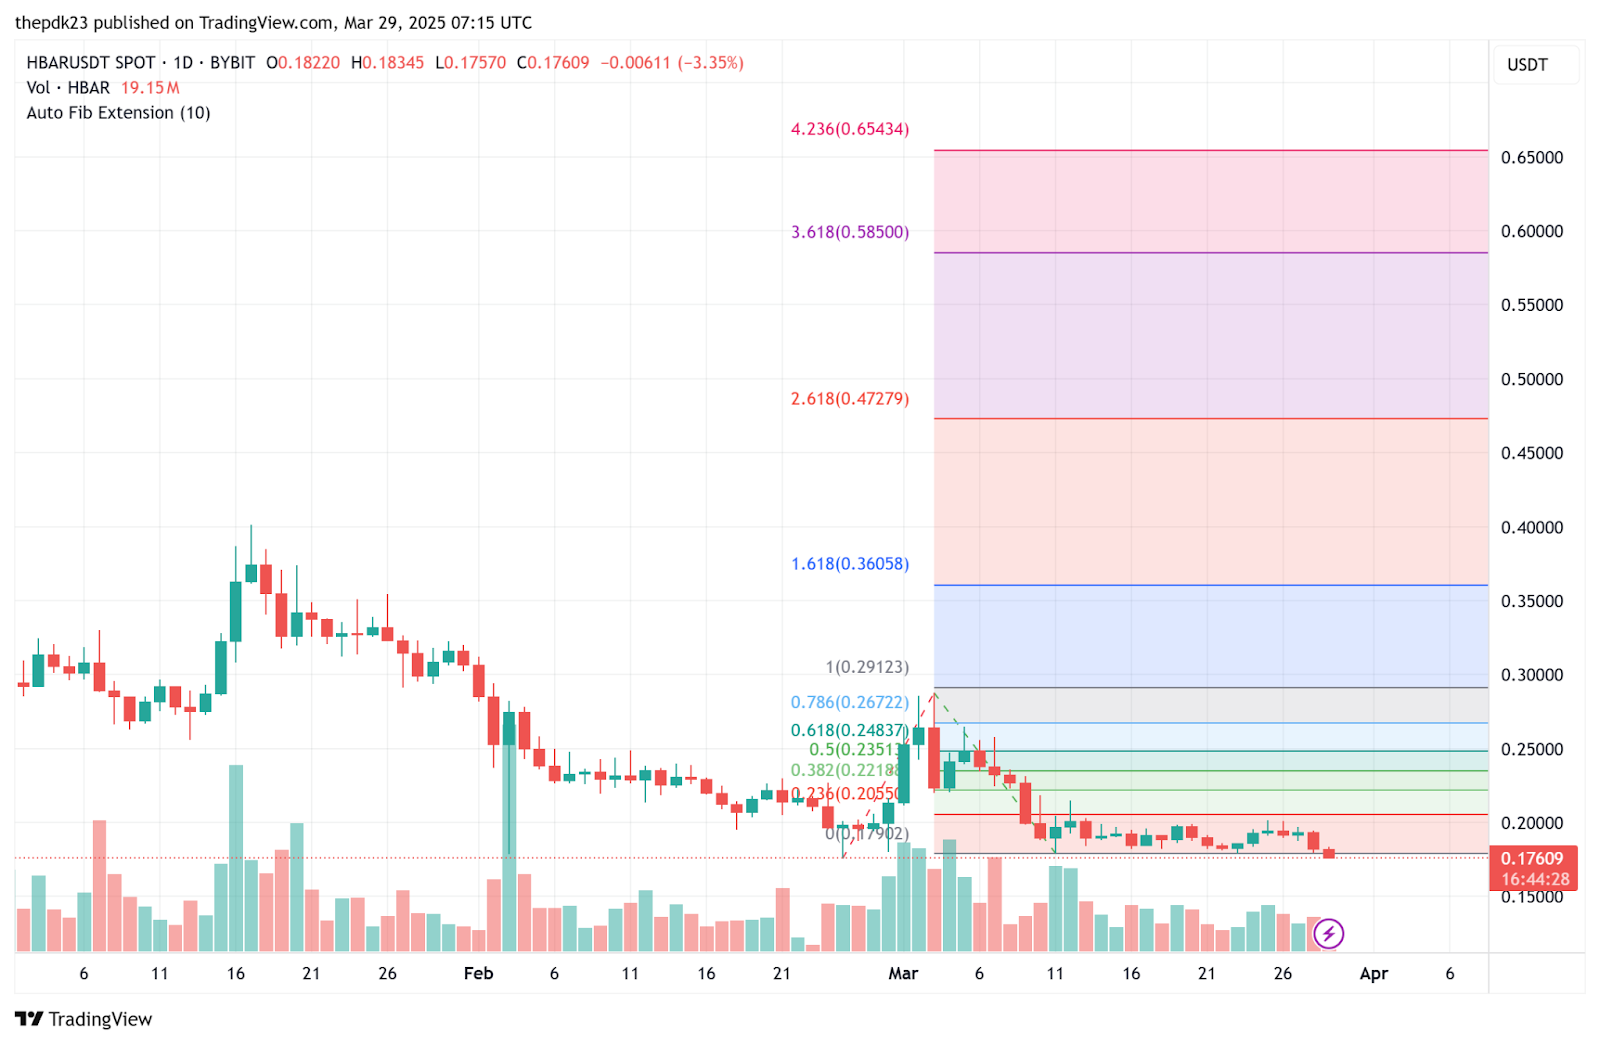
HBAR declined roughly 4.2% over the past 24 hours, trading near $0.1760. Fibonacci retracement analysis places HBAR near a key support zone based on its prior uptrend. If this support area breaks decisively, the next technical downside target sits near $0.1650. This level corresponds to the important 61.8% Fibonacci retracement mark.
Conversely, if buyers successfully step in here, HBAR could aim for a rebound back towards the $0.19 resistance area where sellers previously took control.
Celestia (TIA): Struggles Below 20-Day EMA, OBV Weakens
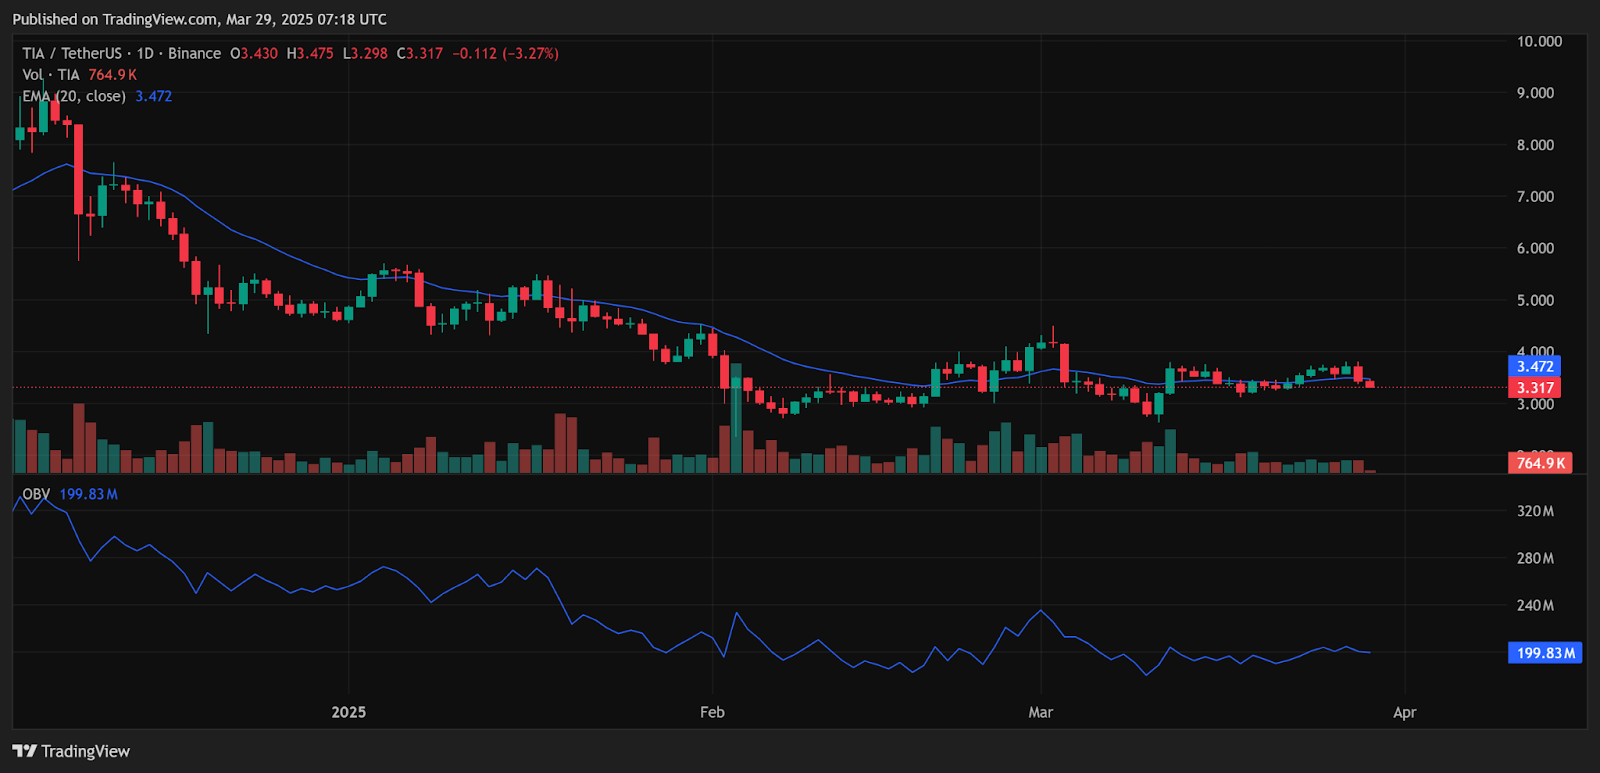
Celestia (TIA) experienced a sharp downturn recently, falling about 8.4% to trade near $3.32. The price currently struggles below its 20-day EMA (around $3.47). This suggests difficulty regaining short-term bullish momentum.
Adding to technical concerns, the On-Balance Volume (OBV) indicator reflects declining buying pressure, potentially indicating weak underlying demand at current levels. If TIA fails to reclaim the 20-day EMA soon, further declines testing the $3 psychological support level appear possible based on the chart structure.
Telcoin (TEL): Testing Lower Bollinger Band Support
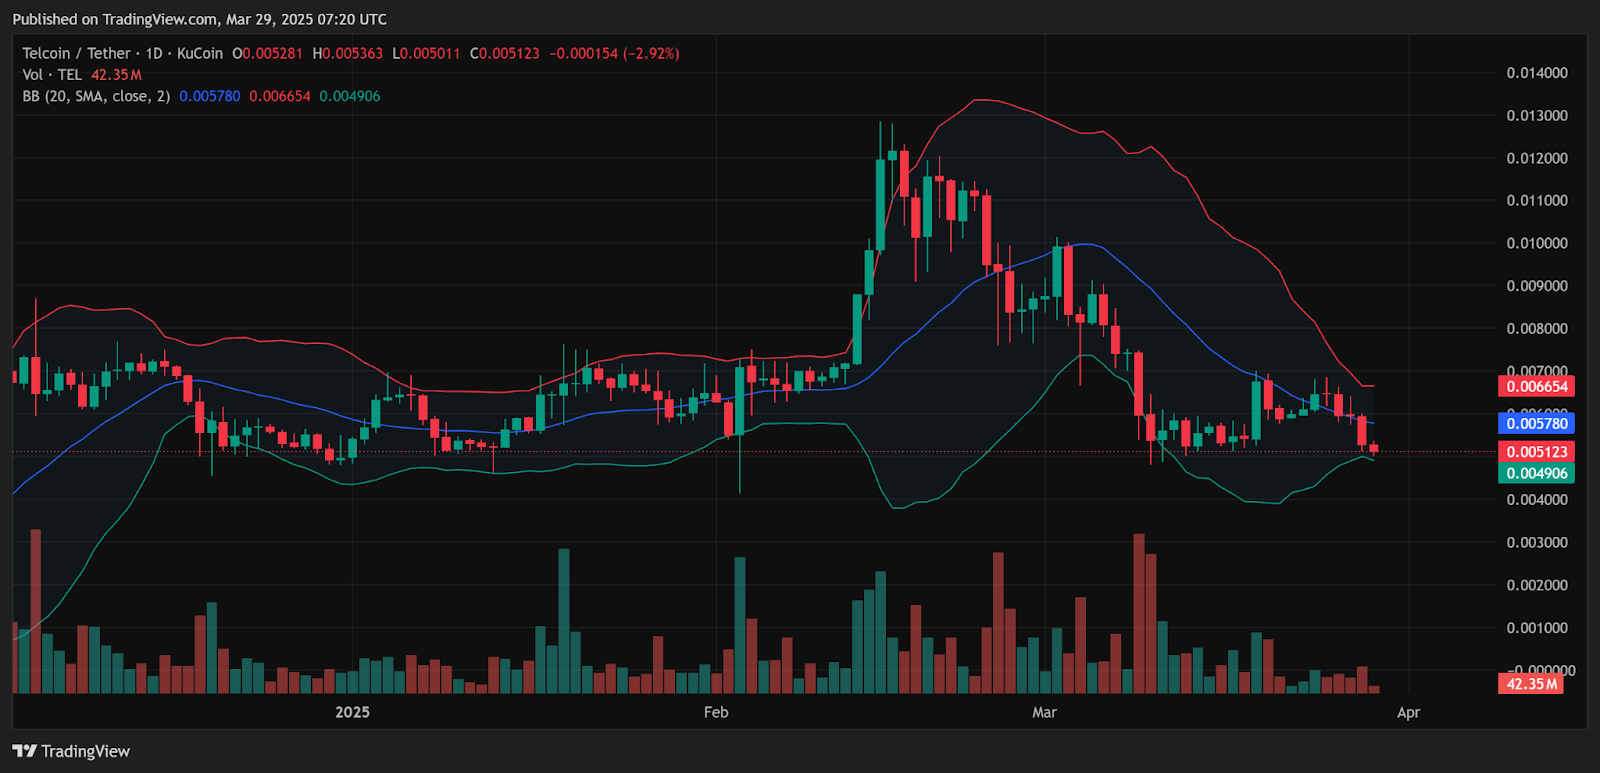
Telcoin (TEL) also faced a significant downturn, dropping over 9% to trade near $0.005137. Current price action actively tests the lower Bollinger Band support level, found around $0.004913. Trading near or below the lower band often suggests potentially oversold conditions, which can sometimes precede a short-term price bounce.
However, if sustained weakness pushes TEL conclusively below this band, the next clear chart support appears near $0.0049. Should buyers re-enter, TEL could see an attempted recovery towards the Bollinger Band mid-line, currently situated near $0.0057.
Disclaimer: The information presented in this article is for informational and educational purposes only. The article does not constitute financial advice or advice of any kind. Coin Edition is not responsible for any losses incurred as a result of the utilization of content, products, or services mentioned. Readers are advised to exercise caution before taking any action related to the company.


