
- Analyst lays out two scenarios for XRP: a parabolic rally to $22-$27 or a confirmation that the cycle top is already in
- The long-term bull case is based on a multi-year parabolic curve pattern that dates back to 2013
- The immediate price is in a falling wedge, with a breakout above $2.90 or a breakdown below $2.70 deciding the trend
XRP dominates crypto talks on social media as analysts weigh whether the asset is gearing up for a parabolic rally or if the cycle top may already be in.
According to renowned analyst EGRAG CRYPTO, XRP is at a critical juncture where it either heads toward the $22–$27 range or risks confirming that the cycle’s peak has already been set.
The Bigger Picture: XRP’s Cycle Projection
EGRAG CRYPTO’s long-term cycle analysis highlights a repeating pattern that dates back to 2013 in Cycle 1, followed by the 2018 peak in Cycle 2, and now points toward a Cycle 3 culmination in 2025.
The analyst’s chart shows XRP respecting a parabolic curve, with major cycle tops aligning along a defined trajectory.
Cycle 1 in 2013 marked the first significant rally that set the foundation for XRP’s long-term trajectory. The second cycle in 2018 saw XRP peak near the curve resistance before undergoing a sharp retracement.
Now, Cycle 3 projected for 2025 indicates a potential peak in the $22–$27 zone, which aligns with the upper parabolic resistance.
Related: Wall Street Gets Creative: Amplify Files for an XRP ETF That Pays a Monthly Yield
EGRAG stresses that $22 is a must-achieve level, otherwise the argument that the top has already formed could be correct.
Short-Term Price Action: XRP in a Falling Wedge
Zooming into the three-hour chart, XRP is currently trading around $2.83 while forming a falling wedge pattern. This structure is generally considered bullish if confirmed with a breakout to the upside.
The On-Balance Volume indicator is showing stability, suggesting accumulation while the Average True Range is holding at 0.04, reflecting compressed volatility. It is possible that a larger move could be on the horizon.
Meanwhile, the Chaikin Oscillator is trending upward, hinting at improving buying pressure, though the Balance of Power remains negative, suggesting sellers still have some control.
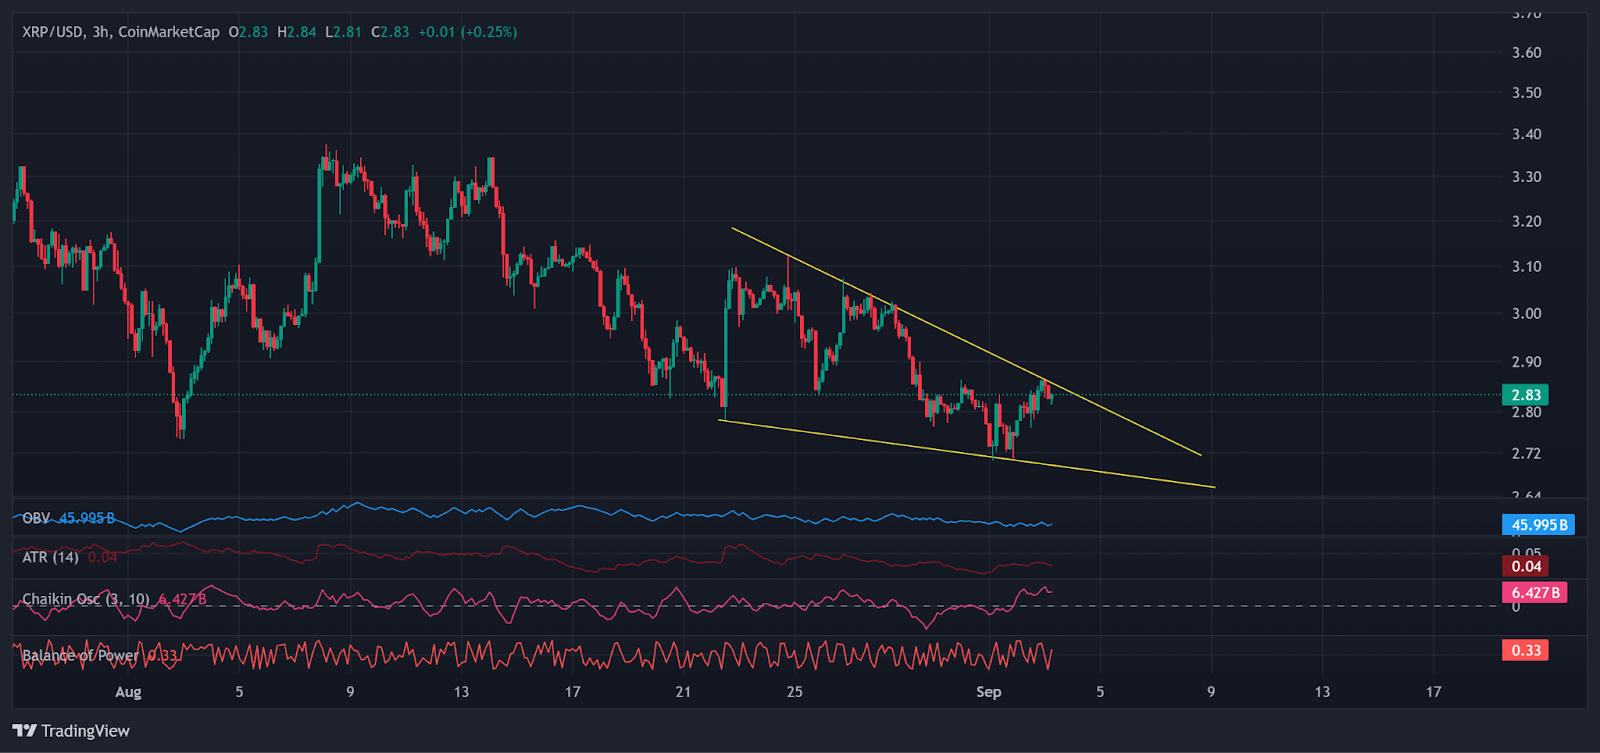
If XRP breaks out of the falling wedge with convincing volume, the immediate resistance lies near the $2.90 to $3.00 zone. Clearing this level could open the path toward $3.50 and $4, before setting up momentum for higher targets aligned with the long-term $22 projection.
Failure to break out of the wedge and a rejection near resistance could drag XRP back toward $2.70 and further down to the $2.50 to $2.60 zone.
This would delay the bullish breakout and potentially fuel the argument that XRP may have already formed a cycle top below expectations.
Related: XRP Price September: Prediction Markets Bet on a Modest Rebound, Not a Breakout
Disclaimer: The information presented in this article is for informational and educational purposes only. The article does not constitute financial advice or advice of any kind. Coin Edition is not responsible for any losses incurred as a result of the utilization of content, products, or services mentioned. Readers are advised to exercise caution before taking any action related to the company.


 Price Prediction: Canton Eyes Key Break After Market Activity Spike")

