
- XRP shows an upward trend with a symmetrical triangle pattern and MACD rising crossover.
- Bollinger Bands indicate XRP rebounded from oversold conditions, causing potential gains.
- RSI at 62.46 signals potential room for growth before the overbought zone is reached.
XRP is gaining traction as technical indicators point to potential bullish momentum. Over the past few weeks, the price of XRP has moved within a well-defined upward trend, suggesting a breakout may be coming.
According to data from CoinMarketCap, XRP is currently trading at around $0.633, recording an increase of 1.06% in price, with a trading volume of over $1.48 billion over the last day.
XRP’s Price Action and Technical Patterns
XRP’s long-term price chart shows an increasing trend dating back to 2014. Analyst JackTheRippler highlighted that XRP is hovering around the middle of this channel, currently consolidating in a symmetrical triangle pattern.
Additionally, the Bollinger Bands on the chart show that XRP recently reached the lower band, suggesting oversold conditions, followed by a rebound.
Read also : Is XRP Poised for a Breakout? Whales and Market Data Say Yes
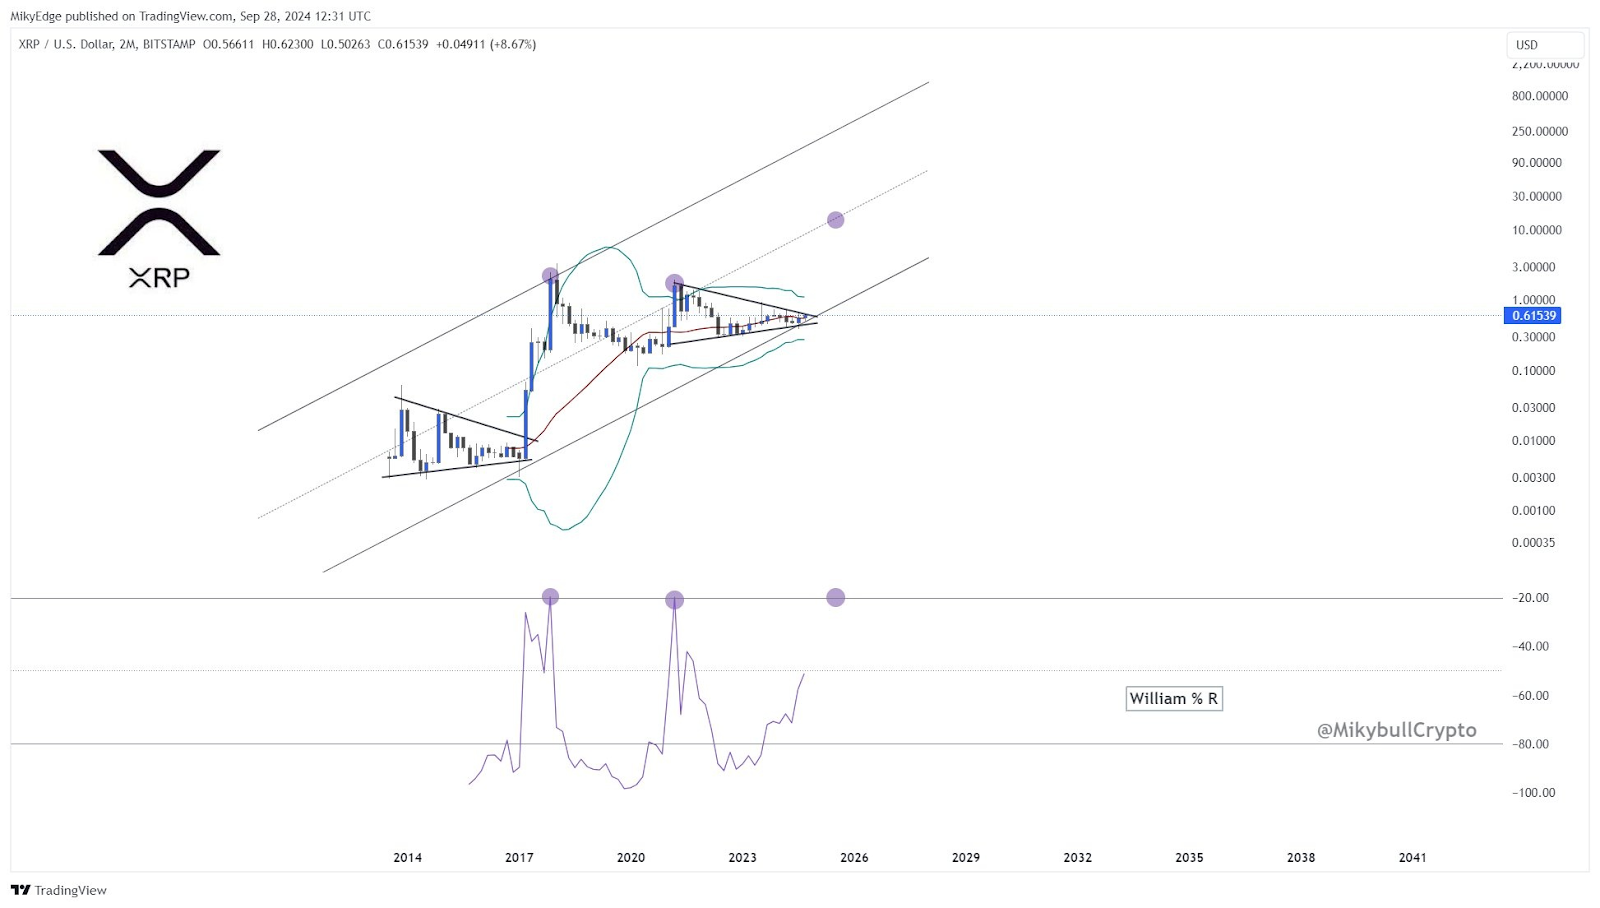
This is supported by the William %R oscillator, which shows that XRP is recovering from the oversold zone, historically a signal to strong upward movements.
Over the past 24 hours, XRP’s price has experienced changes, dropping to as low as $0.614 before recovering to around $0.632. This uncertain movement aligns with cautious views among traders, though the following rally indicates renewed buying interest in the asset.
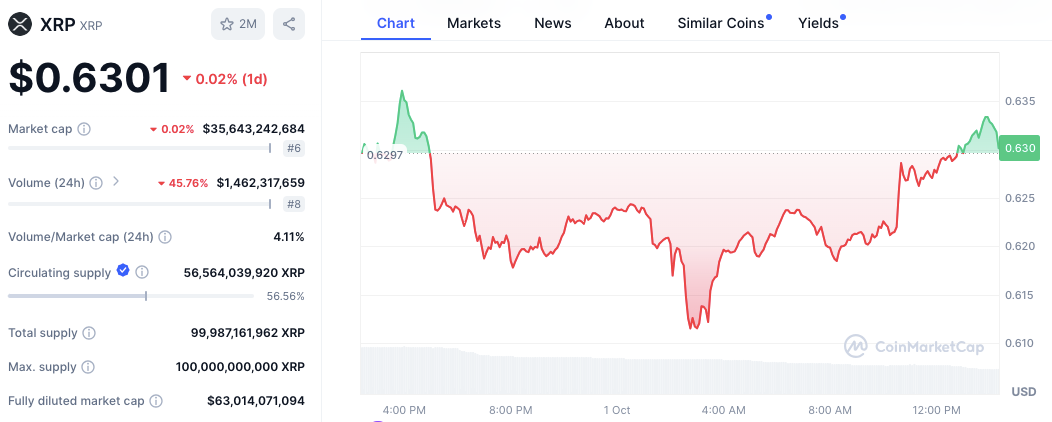
XRP rose to $0.6279, followed by a sharp decline overnight. Then, strong upward momentum occurred at around 10:30 AM, bringing the price back to $0.630.
Read also : XRP Price on the Rise: What’s Driving the Momentum?
The Moving Average Convergence Divergence (MACD) on the Binance exchange displays that the line has crossed above the signal line. Additionally, the MACD histogram has stayed positive, raising the possibility of an upward movement.
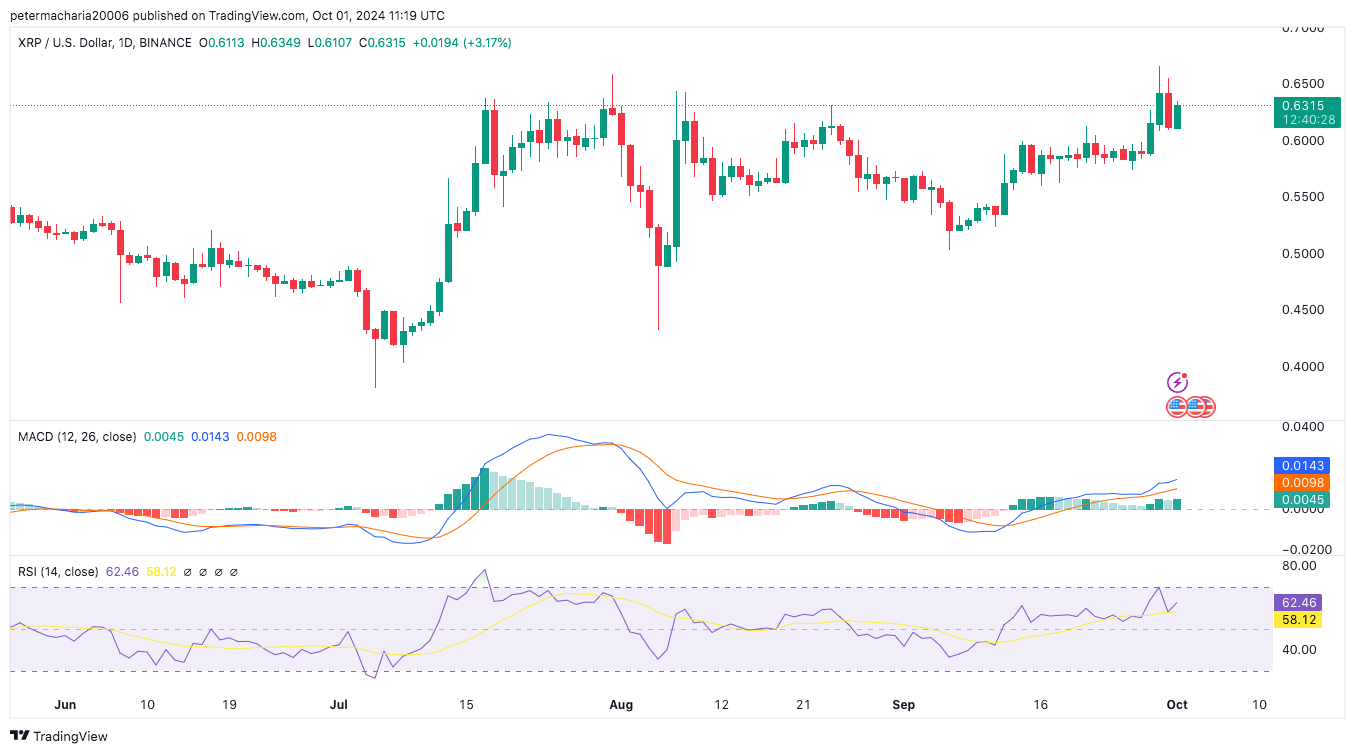
The Relative Strength Index (RSI) currently stands at 62.46, showing that the market is not yet in the overbought zone.
Disclaimer: The information presented in this article is for informational and educational purposes only. The article does not constitute financial advice or advice of any kind. Coin Edition is not responsible for any losses incurred as a result of the utilization of content, products, or services mentioned. Readers are advised to exercise caution before taking any action related to the company.


