
- XRP has formed a head-and-shoulders pattern on the weekly chart, targeting $3.
- The cryptocurrency has also completed a double-bottom formation with $30 target.
- XRP needs to hold above the $2 support for the head-and-shoulders formation to play out.
XRP is showing signs of a strong bullish breakout, having completed a double-bottom formation that often precedes significant price increases.
According to analyst “STEPH IS CRYPTO,” the price has successfully broken through the neckline resistance, confirming the pattern and suggesting further upward movement.
Historically, such formations have triggered substantial price surges, and projections based on the pattern’s height suggest XRP could be a top performer once the broader market turns bullish again.
XRP Price Targets the Bullish Pattern Points To
The long-term chart of XRP reveals a prolonged accumulation phase, mirroring patterns seen before previous bull cycles. Should the current bullish momentum persist, the analyst anticipates XRP could reach a projected target of $30.
However, prominent analyst Ali Martinez has identified a head-and-shoulders pattern forming on XRP’s weekly chart. He emphasizes the critical importance of the altcoin holding the $2 support level.
Related: XRP Defies Market, Outperforms Bitcoin on Key Indicator: Analysis

If XRP maintains its position above this support, a retest of the $2.60 and $3 resistance levels becomes highly probable.
Conversely, should the cryptocurrency fail to hold $2, a drop to the next support level at $1.25 is anticipated, based on the head-and-shoulders pattern’s measurements.
These conflicting patterns have emerged as XRP attempts to reclaim the 20-day Exponential Moving Average (EMA), which currently sits at $2.34. As of the latest data, XRP is trading at $2.28, down 3.18% over the past 24 hours, according to CoinMarketCap data.
XRP Price Analysis
Analyzing the daily chart, the Relative Strength Index (RSI) reads near 47, indicating a potential short-term pullback or consolidation before any further upward movement. However, a break above the 50 level on the RSI could signal a retest of $2.5.
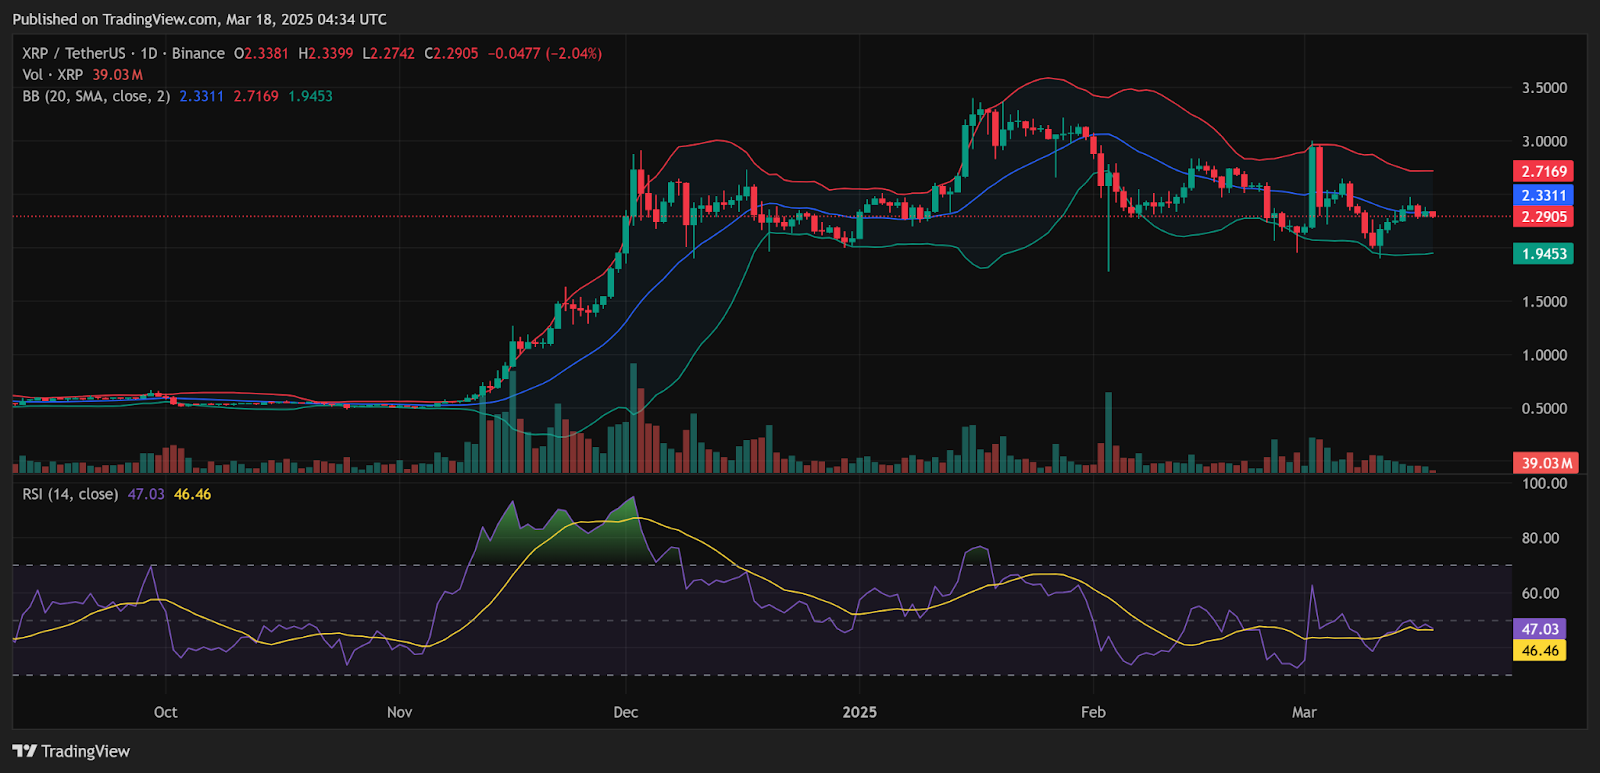
Meanwhile, the price is currently testing the middle Bollinger Band ($2.33), suggesting strong momentum could follow if buyers establish this level as support.
Related: XRP ETF dreams on hold thanks to the SEC, Litecoin and DOGE step up
The next upside target would be the upper Bollinger Band ($2.71), but a rejection here might lead to a temporary retracement towards the lower Band support ($1.94), potentially validating the head-and-shoulders pattern.
Disclaimer: The information presented in this article is for informational and educational purposes only. The article does not constitute financial advice or advice of any kind. Coin Edition is not responsible for any losses incurred as a result of the utilization of content, products, or services mentioned. Readers are advised to exercise caution before taking any action related to the company.
 Price Prediction: Weak Momentum Signals Possible Drop to $62K")

 Price Prediction for April 2026: Will Chainlink Move Higher?")
 Price Prediction: Can Bulls Sustain the $0.045 Push?")
