
- XRP price dips ~6% to ~$2.13, falls below key 20-day EMA support level
- Bitwise offers 2025 scenarios: $4.48 bullish (tokenization) vs $1.82 bearish
- Analyst TehThomas sees ‘Golden Pocket’ Fib support, potential bounce to $2.80+
XRP is the focus of discussion, particularly following the SEC officially dropping its lawsuit against fintech firm Ripple regarding past XRP sales. However, this major regulatory development hasn’t yet produced the significant price surge many anticipated for XRP itself.
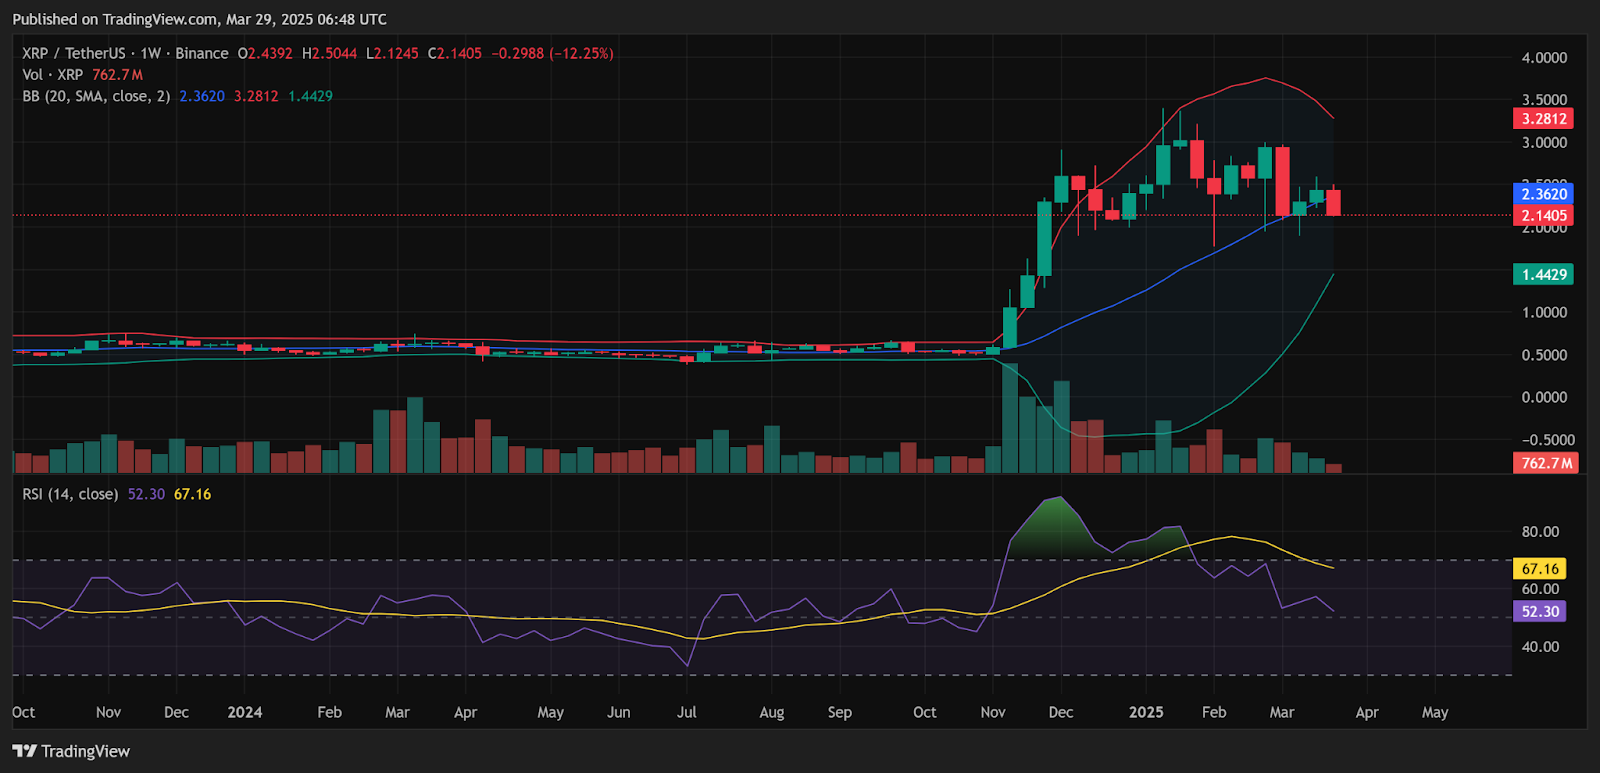
The token currently trades around $2.13, marking a 6% drop in 24 hours, according to CoinMarketCap. After reaching a weekly high near $2.50, XRP faced a sharp correction, losing support at the 20-day Exponential Moving Average (EMA) around $2.17. This price action sparks debate on whether XRP is headed for a deeper fall or positioning for a major rebound.
Bitwise 2025 Scenarios: Tokenization Boom vs. Institutional Lag?
Investment firm Bitwise recently released a report exploring potential price paths for XRP through the end of 2025. Their analysis suggests outcomes depend heavily on XRP’s adoption momentum, particularly for payments and within the broader digital asset tokenization market (projected by some to reach nearly $11 trillion by 2030).
In Bitwise’s bullish scenario, XRP could reach $4.48 by year-end 2025, assuming it captures even a small percentage of this expanding market. A steadier growth outlook in their analysis projects $3.90 for XRP, assuming consistent growth in related payment services (like those offered by Ripple).
Conversely, Bitwise stated a bearish scenario occurs if XRP fails to gain significant institutional backing, potentially seeing the price drop to $1.82 in that case.
Related: XRP’s $2.22 Support Test: Make-or-Break Level for a Bullish $15 Scenario
Chart Analyst Sees Bullish Pattern: XRP in ‘Golden Pocket’?
Offering a contrasting, potentially more near-term bullish technical view, TradingView analyst “TehThomas” presented a different setup for XRP. He notes the asset currently trades within what appears to be an ascending channel pattern, often characterized by higher highs and higher lows indicative of an underlying uptrend.
TehThomas highlights XRP’s price now sitting within the 0.618–0.65 Fibonacci retracement zone of a prior upward move. This area, technically known as the “Golden Pocket,” is historically considered a strong potential reversal or support zone by chart analysts. He also notes the price aligns with an “imbalance zone,” suggesting price might naturally revisit these levels before potentially resuming an upward trend.
Bounce to $2.80 Possible? Indicators Show Neutrality
If XRP successfully holds the current levels within this Golden Pocket zone as key support, TehThomas predicted it could rally approximately 20% toward the $2.80–$2.90 resistance range.
Current daily indicators provide additional context. The Relative Strength Index (RSI) reads near 52, suggesting a relative balance between buyers and sellers, although its recent downward gradient hints at increasing sell-side pressure.
Related: Misinformation vs Reality: Clarifying XRP’s Actual Role in Global Payments
XRP’s price also trades near the Bollinger Bands’ mid-line, often signaling a potential consolidation phase. Key levels defined by the bands suggest a break below support near $2.10 could risk a test of the lower band (around $1.44), while a convincing move above resistance near $2.36 is needed to trigger a stronger rally attempt.
Disclaimer: The information presented in this article is for informational and educational purposes only. The article does not constitute financial advice or advice of any kind. Coin Edition is not responsible for any losses incurred as a result of the utilization of content, products, or services mentioned. Readers are advised to exercise caution before taking any action related to the company.


