
- XRP trades near $2.25, holding $2.20 support as sellers defend the descending trendline for a third straight session.
- Coinglass data shows $9.4M in outflows, extending XRP’s multi-week distribution trend as traders reduce exposure.
- Resistance stands at $2.30–$2.35, while a daily close below $2.20 could trigger a deeper move toward $2.05 and $1.95.
XRP price today trades near $2.25 after defending the $2.20 zone for a third straight session. The market remains under pressure as sellers continue to lean on the descending trendline while spot flows struggle to turn positive. Momentum stays fragile, and buyers have yet to show meaningful commitment at higher levels.
Spot Outflows Continue As Market Stays Defensive
Coinglass data shows $9.4 million in spot outflows in the latest session. This print extends a multi-week pattern where red bars dominate the flow profile. The market has repeatedly shown preference for sending liquidity off exchanges instead of absorbing supply.
Across the past two months, XRP has struggled to build any stretch of sustained green inflows. Even during brief price recoveries, outflows remained elevated, signaling that traders are still not positioning for an upside reversal.
Descending Trendline Keeps Price Pinned Below EMAs
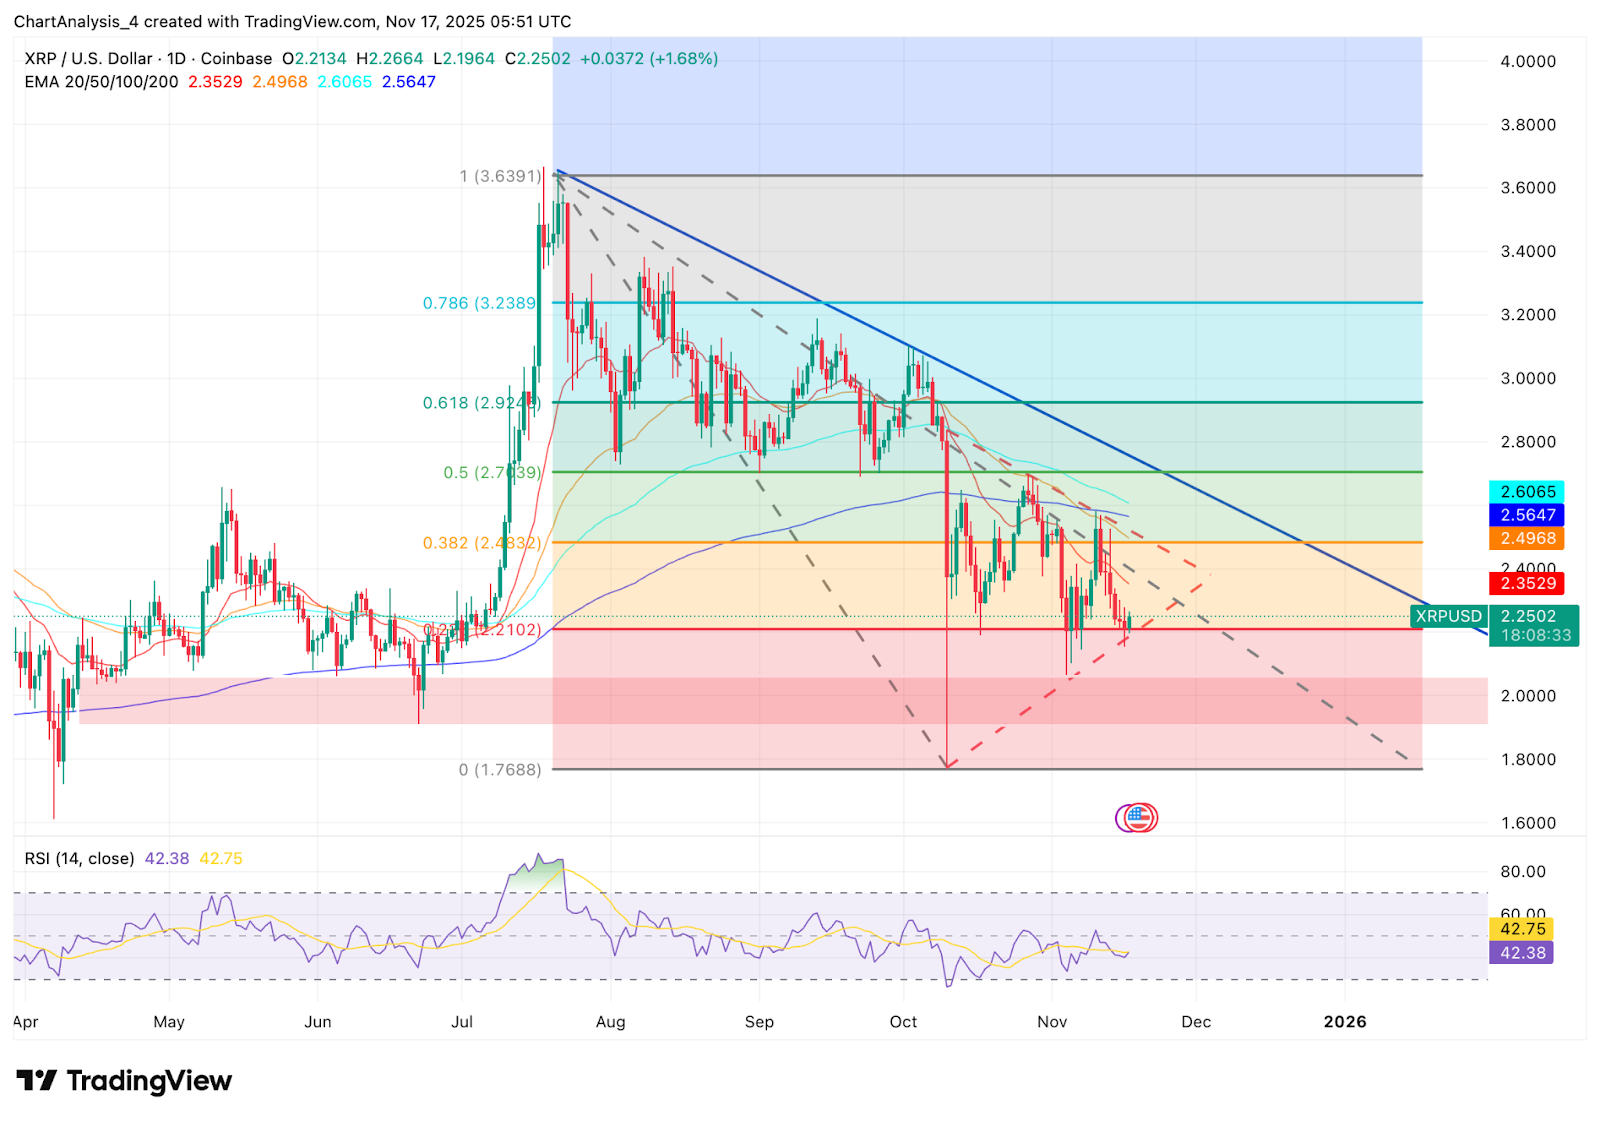
The daily chart shows XRP capped by a firm descending trendline that has guided every rejection since July. Price sits below the 20, 50, 100, and 200 EMAs, which cluster between $2.35 and $2.56. This stacked formation creates a heavy ceiling that reinforces the bearish lean.
Each bounce into this resistance zone has failed. Sellers defended the 0.382 Fibonacci level at $2.83, then the 0.5 level at $2.77, and now the 20 EMA near $2.35. This progression highlights a market losing elevation at every pivot.
The $2.20 area remains the key support on the daily timeframe. A break below it exposes the deeper retracement zone between $2.05 and $1.95, which aligns with the lower boundary of the long-term Fib retracement.
RSI at 42 keeps momentum neutral to weak. The lack of higher lows confirms that buyers are not establishing control.
Intraday Structure Shows A Downslope Channel
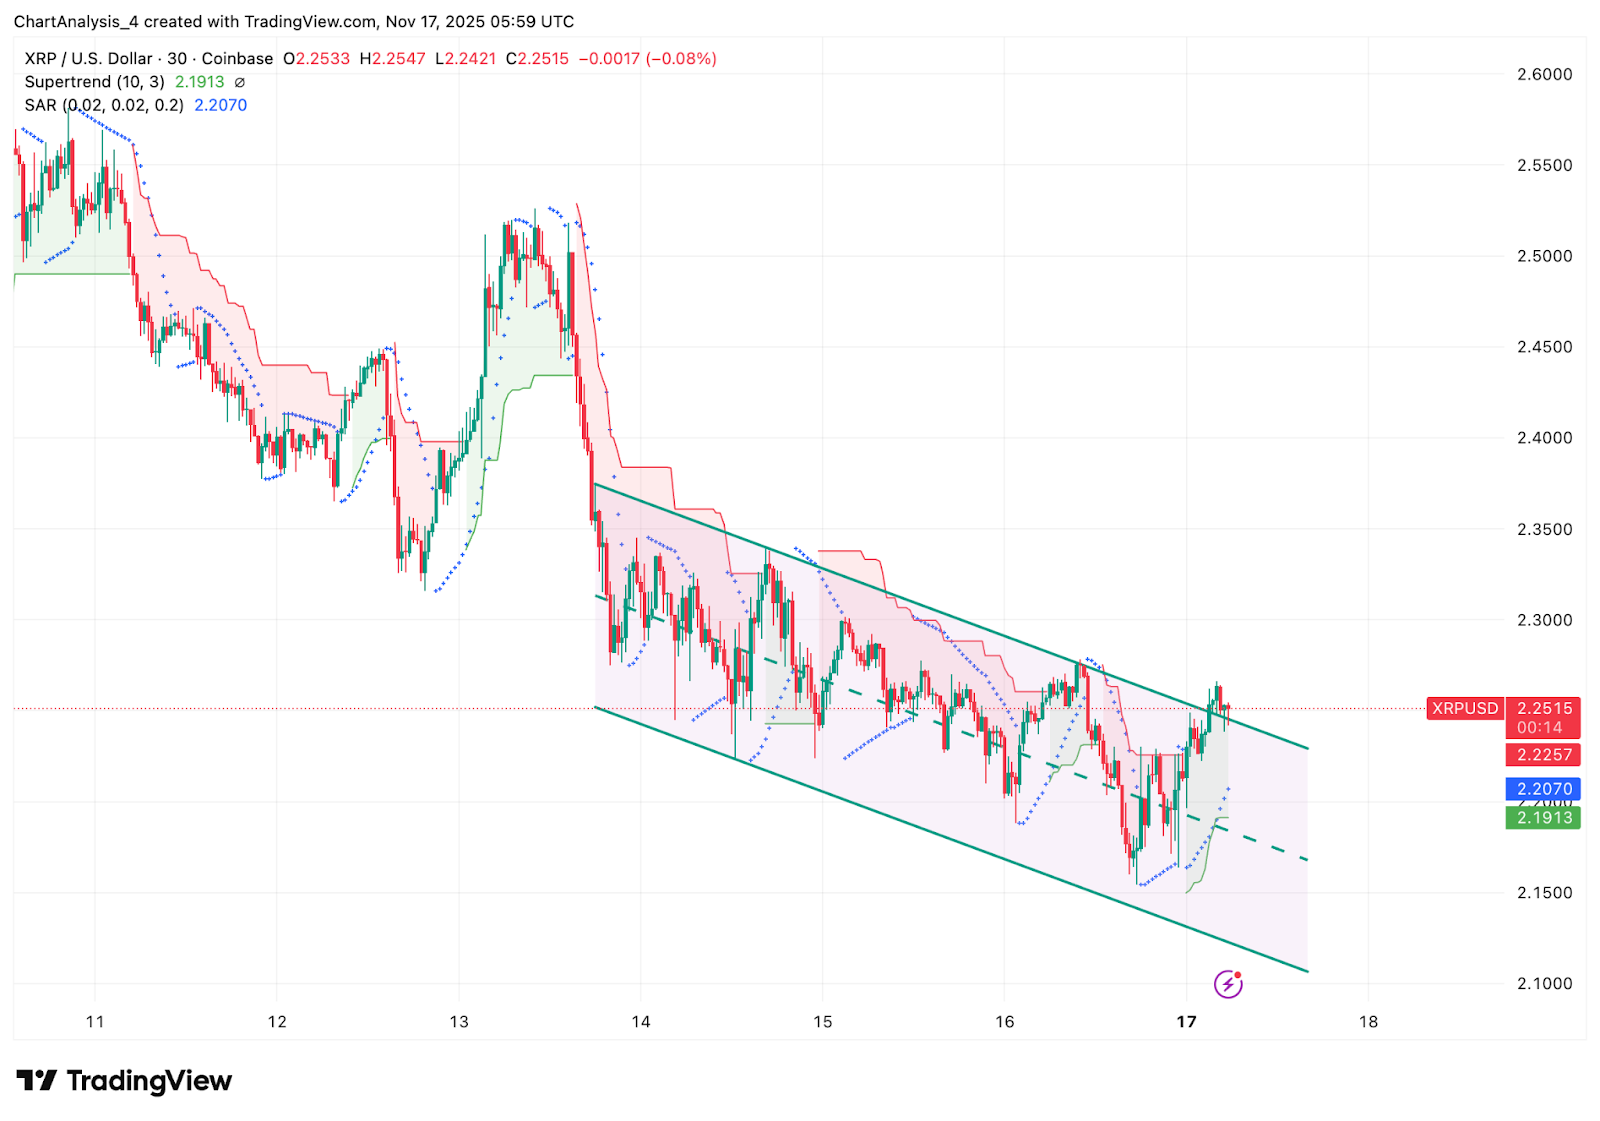
On the 30-minute chart, XRP trades inside a clean downward channel. Price has tested the upper boundary twice but failed to break out. Supertrend remains red, and the Parabolic SAR prints above price on most swings, confirming intraday selling pressure.
Short-term support sits near $2.19, where price has repeatedly bounced. A breakdown would signal fresh momentum from sellers and open a path toward the $2.12 channel floor.
Intraday recovery attempts remain shallow. Price needs to reclaim $2.30 to show the first sign of strength. Without that, any bounce stays corrective.
Open Interest Rises But Positioning Skews Cautious
Derivatives data shows open interest rising 1 percent to $3.68 billion. Trading volume is up 48 percent, reflecting active repositioning rather than confidence.
The long-short ratio sits near 0.96, indicating balanced positioning across the market. However, top trader ratios on Binance lean long, suggesting that experienced traders may be attempting early positioning for a reversal.
Even with rising open interest, liquidation data shows no aggressive wipeout on either side. This suggests the market is preparing for a larger move but has not yet committed to a direction.
The message from futures markets is caution. Participation is increasing, but conviction remains thin.
Key Levels To Watch
Resistance:
- $2.30: First test required for any upside attempt
- $2.35: 20 EMA and repeated rejection point
- $2.56: 50 and 100 EMA cluster
- $2.92: 0.618 Fib and major breakout barrier
Support:
- $2.20: Critical short-term base
- $2.05: Channel midpoint and Fib alignment
- $1.95: Major demand zone and lower liquidity shelf
Outlook. Will XRP Go Up?
XRP remains trapped under the descending trendline with no confirmation of a trend shift. Bullish momentum returns only if price reclaims $2.35 with a close supported by improved spot flows. A break above $2.56 would open the path toward $2.77 and eventually $2.92.
The bearish case activates if XRP loses $2.20. A daily close below this level exposes $2.05 and possibly $1.95 as the next liquidity zones. Sellers remain in control until buyers show strength at resistance rather than just defending support.
Disclaimer: The information presented in this article is for informational and educational purposes only. The article does not constitute financial advice or advice of any kind. Coin Edition is not responsible for any losses incurred as a result of the utilization of content, products, or services mentioned. Readers are advised to exercise caution before taking any action related to the company.


